Remodeling Website Speed: The Gallery Behind 10-Second Loads
The average remodeling site loads in 10.16 seconds on mobile, and the before/after gallery is what drags it down. See the remodeling website speed fix.

Here's a number that should stop you cold. Of the 146 remodeling contractor websites Fervor scored, 109 returned a mobile Lighthouse run — and on the 107 with a measurable reading, the average homepage took 10.16 seconds to render its main content. Ten seconds. Not on a bad connection, not on an old phone — that's the average experience of a homeowner thumbing through your site at a stoplight. So if you've never once thought about your remodeling website speed, the Lighthouse numbers say it is almost certainly the slowest thing standing between you and a booked consultation.
And the cruel part? The thing slowing you down is the same thing you're proudest of. Your before/after gallery. Those gorgeous full-resolution shots of the kitchen you gutted and rebuilt — uncompressed, in the wrong format, all loading at once. The work that sells the job is the exact weight that's tanking the site that's supposed to sell it. That's not a small irony. That's a leak.
So let's walk through what all that lag is actually costing you, why Google's grading you on it whether you like it or not, and what the fix looks like. No vague "optimize your site" advice. Just the numbers and the steps.
What "slow" actually means for a remodeling website
Quick reality check, because "fast enough" is in the eye of whoever built your site. Google has a hard threshold for this, and it's called Largest Contentful Paint. LCP measures how long it takes for the biggest visible element, usually your hero image or that gallery banner, to actually paint on screen. Google's "good" LCP cutoff is 2.5 seconds. Under that, you're fine. Over four seconds, you're in the band Google literally labels "poor."
Now look at where remodeling sits. The trade's average mobile LCP is 10.16 seconds. The median is 7.57. Both numbers are miles past the four-second poor line, and they're four times Google's good threshold. And this isn't a few stragglers dragging the average down either.
- 85.3% of the 109 measured remodeling homepages fall in Google's "poor" LCP band, which means over four seconds on mobile.
- Mean mobile LCP across the 107 sites with a Lighthouse reading is 10.16 seconds; the median is 7.57 seconds.
- The "good" LCP target you're being measured against is 2.5 seconds.
So when we talk about remodeling website load time, we're not splitting hairs over a fraction of a second. We're talking about most of the trade sitting at three to four times the limit. The homeowner's already gone before your hero image finishes loading.
Why mobile is the number that matters
You probably check your own site on a laptop, on office wifi, where everything snaps in fast. But that's not how your customers arrive. A homeowner researching a $60,000 kitchen remodel does it from the couch, on their phone, on a cellular connection. That's why every number above is a mobile number. The desktop experience flatters you. The mobile experience is the one losing you the lead, and it's the one Google indexes first.
The Core Web Vitals scorecard nobody showed you
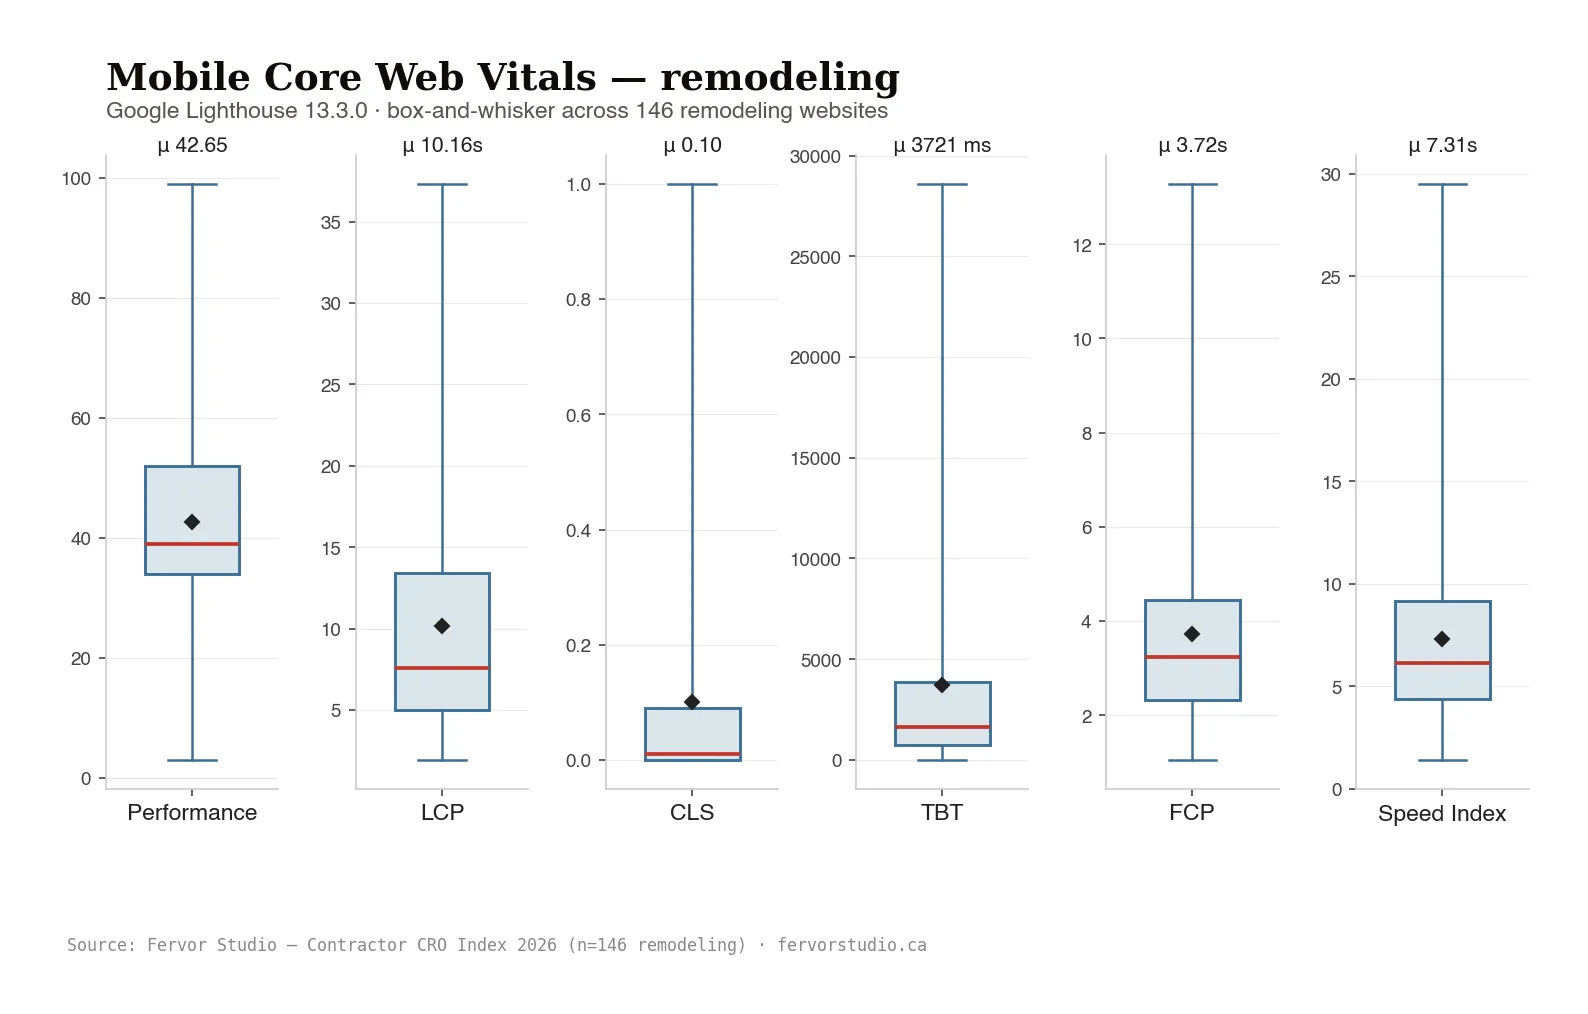
Here's where it gets uncomfortable, because speed isn't a vibe. It's a graded test. Google rolled Core Web Vitals into its ranking signals, and LCP is the headline metric. Lighthouse, the tool that scores it, hands every page a performance number from 0 to 100. The remodeling trade's average Lighthouse performance score is 42.65. The median is 39.
For context, a 39 is a failing grade by any reading. Google's own bands put anything under 50 in the red. So the typical remodeling site is scoring in the bottom third of a test that directly feeds where you land in search results. And the whole remodeling trade averaged 65.67 out of 100 on Fervor's framework across every scored category, with a slow site a big reason why.
And this matters beyond ego. Core web vitals are a tiebreaker Google uses when two sites are otherwise close. If you and the remodeler across town both target "kitchen remodel near me," and their page paints in three seconds while yours takes ten, you've handed them the edge before a single homeowner reads a word. You did the better work. You're losing the click anyway.
What Lighthouse is actually penalizing
A 39 doesn't come from nowhere. When Lighthouse cracks open one of these sluggish sites, it almost always finds the same culprits: enormous unoptimized images, images served in formats from a decade ago, and a page that tries to load every single one of them before the visitor can do anything. The score is the symptom. The gallery is the disease.
The gallery problem, named
Let me be specific, because this is the whole story. Your before/after gallery is the single best sales asset you have. A homeowner doesn't trust a list of services. They trust the photo of the dingy 1990s bathroom on the left and the spa-grade walk-in shower on the right. That contrast closes jobs. So I'd never tell you to cut it.
But here's what's happening under the hood. The median remodeling site loads 112 images. And only 32.9% of remodeling sites use any modern image format at all. No WebP, no AVIF, nothing. So two-thirds of the trade is serving giant JPEGs and PNGs straight off a phone camera, often two, three, four megabytes apiece, a hundred of them, all firing on the first page load.
So that's the math that produces a 10-second LCP. It's not mysterious. A hundred-plus heavy images in an obsolete format, no lazy-loading, all racing to download over a cell connection. The browser chokes. The homeowner waits. Then they don't.
- The median remodeling site loads 112 images per page.
- Only 32.9% use a modern image format like WebP or AVIF. The other 67.1% are shipping legacy files.
- Those images are the largest single weight on the page, and the biggest single thing dragging your homepage down.
Why "it loads fine for me" is a trap
You've seen your gallery a hundred times. Your browser has every one of those images cached, so it paints instantly for you. But a first-time visitor's browser has none of it. They download all 112 from scratch, cold, on the worst connection of anyone who'll ever see your site. The version of your gallery that loads fast for you is the one version no customer will ever experience.
What a slow remodeling website costs you
Run the napkin math, because this is a leak with a dollar figure. Say the average remodeling project you book is worth $35,000, and your site pulls 60 mobile visitors a week looking at your work. Industry data on bounce is brutal here: a meaningful share of mobile visitors abandon a page that takes more than a few seconds to load, and yours takes ten.
If even one in fifteen of those weekly visitors bounces off a frozen gallery before they ever reach your contact form, that's four lost visitors a week. And most won't have converted anyway. But remodeling is a high-ticket, low-volume game, so you don't need many. If just one of those bounced visitors a quarter would've booked, that's a single $35,000 job a year walking out because your images wouldn't load. From a fix that's a weekend of compression.
That's the part that stings. The cost isn't theoretical and it isn't small. One slow homepage, one lost whale of a job, and you've paid more in missed revenue than a full site rebuild would've cost. The leak compounds every week the gallery stays heavy.
What good looks like
The encouraging part, and it's a big one: this is a fix, not a rebuild. The remodeling sites that hit Google's good LCP band didn't redesign anything. They didn't drop the gallery. They just stopped shipping it wrong. And three changes do almost all the work.
- Compression. Run every gallery image through a compressor before it goes live. A four-megabyte kitchen photo becomes a 300-kilobyte one that looks identical on a phone screen. That alone can cut your load time in half.
- Modern formats. Convert to WebP or AVIF. You'd join the 32.9% minority instead of the slow majority, and you'd shave another 25-35% off each file with no visible quality loss.
- Lazy-loading. Stop loading all 112 images at once. Lazy-loading tells the browser to load only what's on screen and fetch the rest as the visitor scrolls. Your hero paints fast; the gallery streams in behind it.
None of that touches how your work looks. The before/after shots stay sharp, the contrast stays dramatic, the job-closing power stays intact. The only thing that changes is the homeowner sees it in two seconds instead of ten.
Where to start this week
If you do one thing, compress your hero image and your homepage gallery. That's where LCP gets won or lost. The biggest visible element is almost always a hero or gallery shot, and shrinking it moves the needle more than anything else. After that, convert your most-viewed pages to WebP and switch lazy-loading on. Then check yourself: drop your homepage into Google's PageSpeed Insights and read the mobile LCP number. If it's still over 2.5 seconds, you've got more weight to shed.
Then keep it a habit, because remodeling website speed rots. Every new project you add to the gallery is another heavy image if nobody's compressing on the way in. The sites that stay fast bake compression into their upload process, so a fresh photo can't quietly re-break the page.
Frequently asked questions
Why is my remodeling website so slow?
Almost always, it's your images. And the median remodeling site loads 112 of them, with two-thirds of the trade shipping them in old formats with no compression. A hundred uncompressed photos firing on one page load is what drags the average mobile LCP to 10.16 seconds. Your gallery is the most likely culprit, not your hosting or your platform.
What's a good page speed for a remodeling website?
Google's "good" Largest Contentful Paint threshold is 2.5 seconds on mobile. That's the number to beat. The remodeling trade averages 10.16 seconds, so most sites are four times over. A Lighthouse performance score of 90 or above is the target; the trade's median sits at 39.
Does website speed actually affect my remodeling leads?
Yes. Core web vitals feed Google's rankings, so a slow site shows up lower in search before anyone clicks. And mobile homeowners bounce off slow galleries before they reach your contact form. For a high-ticket trade like remodeling, a single lost lead can mean a lost $35,000 job.
Can I keep my before/after gallery and still be fast?
Absolutely, and you should keep it. The gallery isn't the problem. Unoptimized images are. Compress every photo, convert to WebP or AVIF, and turn on lazy-loading so images load as the visitor scrolls. Your gallery stays just as sharp; it just loads in seconds instead of timing out.
What are Core Web Vitals and do they matter for remodelers?
Core Web Vitals are Google's set of speed and stability metrics, with Largest Contentful Paint as the headline. They're a confirmed ranking signal, so yes, they matter for any remodeler competing for local search terms. The remodeling trade's average Lighthouse performance score of 42.65 means most sites are leaving rankings on the table.
How do I check how fast my remodeling website loads?
Run your homepage through Google's free PageSpeed Insights tool. It reports your mobile LCP, your Lighthouse performance score, and flags the exact images dragging you down. Read the mobile number, not the desktop one. Mobile is where your homeowners actually arrive, and where Google grades you first.
Methodology
Where these numbers come from
Every speed figure in this post traces to the State of Remodeling report, part of the Contractor CRO Index. Fervor scored 146 remodeling contractor websites in the Fervor Grade Framework; 109 returned a mobile Lighthouse run, and mobile Largest Contentful Paint was measurable on 107 of those homepages, scoring speed as one of several categories. The trade earned a D, a 65.67 mean across every scored category. The 2.5-second "good" LCP threshold and the four-second "poor" band are Google's published Core Web Vitals cutoffs. Every site in the sample is named and publicly graded inside the Contractor CRO Index — the State of Remodeling report is the aggregate layer on top of those public teardowns.
See where your site actually stands
You don't have to guess at your own number. The State of Remodeling report shows exactly how the trade scores on speed and five other conversion categories, all measured mechanically against the same framework, as part of the Contractor CRO Index. And if you want your own site scored, including the real mobile LCP, the gallery weight, and the specific images slowing your load time, the free Site Inspection returns the exact list of what's dragging your remodeling website speed down. Better to read that list from us than to keep losing the click you earned.
Get My Free Inspection →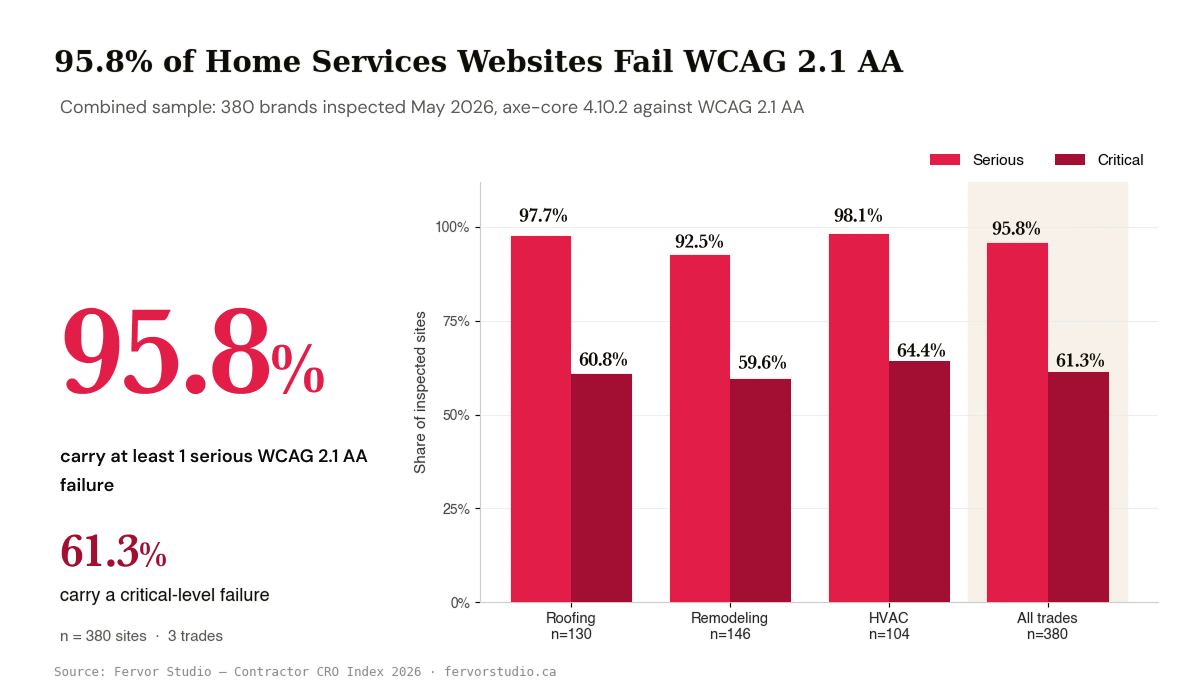 Jun 17, 2026
 Accessibility
95.8% of Home Services Websites Fail the Standard Behind ADA Lawsuits
An independent study of 380 home services websites found 95.8% carry serious WCAG 2.1 AA failures and 61.3% carry critical ones. Accessibility was the study's weakest category.
Read Article Jun 2, 2026
 CRO
HVAC Website Conversion: Where 26% of Sites Lose the Call
74% of HVAC sites nail the phone-in-header, but most leave online scheduling, SMS, and a hero lead form on the table. That gap is where the calls leak out.
Read Article Jun 2, 2026
 CRO
HVAC Maintenance Plan Website: The Upsell 2 in 3 Surface
Two in three HVAC sites surface the maintenance-plan upsell, and a third bury it. Here is what a strong maintenance-plan page does, plus the recurring revenue the rest leave uncaptured.
Read Article