Contractor CRO Index · State of the Industry · 2026
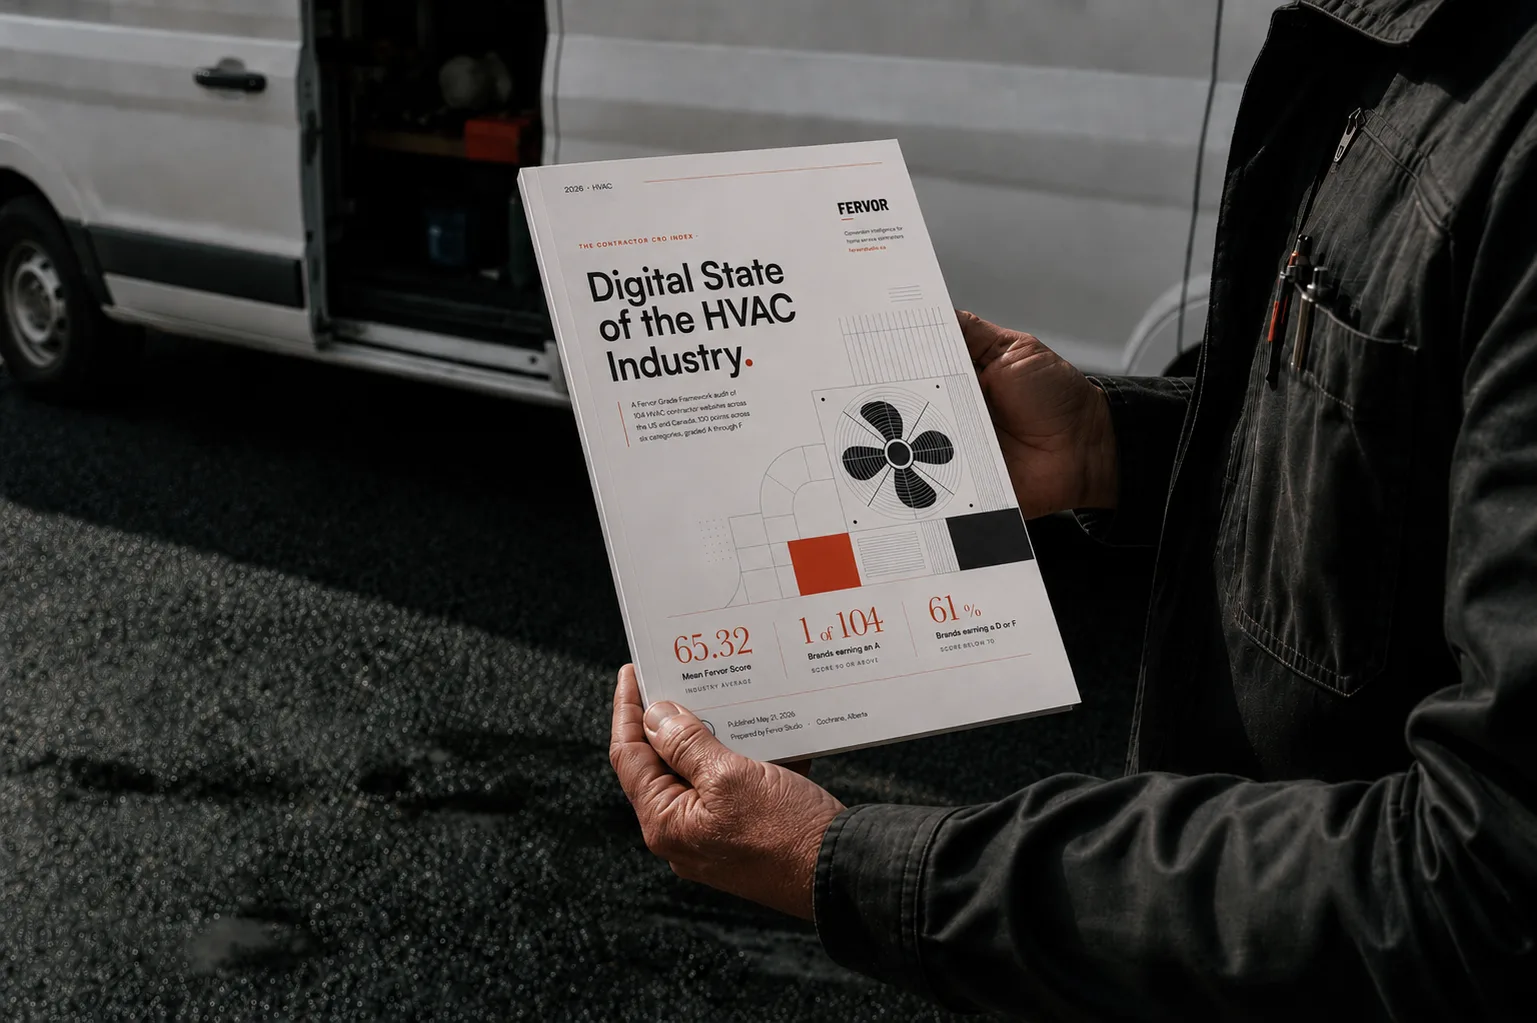
Digital State of the Home Services Industry 2026: 380 websites studied
Construction industry marketing has three sub-pillars: CRO, SEO, and web design. We scored 380 contractor websites across three trades (roofing, remodeling, and HVAC) from 2026-05-10 to 2026-05-22, on one 100-point Fervor Grade Framework. Combined, they average 66 of 100, a D grade. 85.5% grade below passing and 95.8% carry a serious accessibility violation. The spread between trades is just 2.5 points.
- 66 Combined mean Fervor Score across all 380 sites (out of 100). A D grade. Source: Fervor Studio, Contractor CRO Index 2026 (n=380 contractor sites, roofing + remodeling + HVAC)
- 85.5% Combined share grading at C or worse (51.1% land at D or F). Source: Fervor Studio, Contractor CRO Index 2026 (n=380 contractor sites, roofing + remodeling + HVAC)
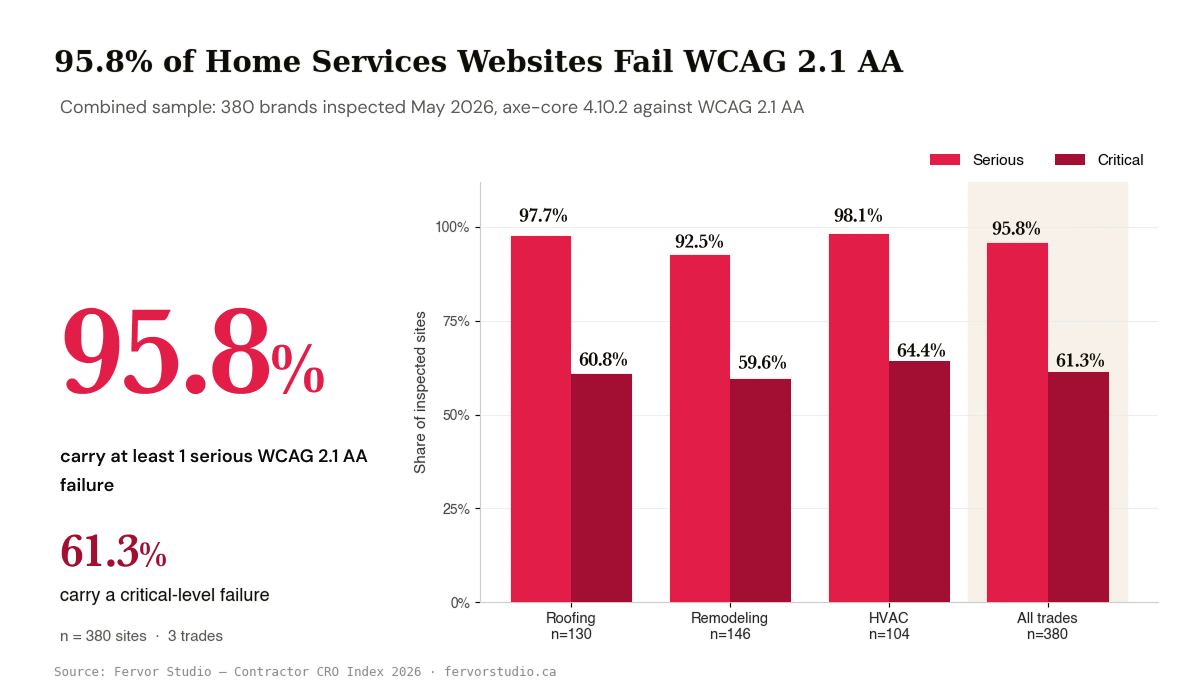
- 95.8% Combined share with a serious WCAG 2.1 AA violation (364 of 380). Source: axe-core 4.10.2 (WCAG 2.1 AA), Fervor Studio, Contractor CRO Index 2026 (n=380 contractor sites, roofing + remodeling + HVAC)
- 61.3% Combined share with a critical WCAG 2.1 AA violation across captured pages. Source: axe-core 4.10.2 (WCAG 2.1 AA), Fervor Studio, Contractor CRO Index 2026 (n=380 contractor sites, roofing + remodeling + HVAC)
- 2.5 Spread from the top trade mean to the bottom (roofing 67.82, remodeling 65.67, HVAC 65.32). Source: Fervor Studio, Contractor CRO Index 2026 (n=380 contractor sites, roofing + remodeling + HVAC)
- 82.8% Combined share with a poor mobile LCP. Google "poor" threshold is 4s. Source: Google Lighthouse 13.3.0 (mobile), Fervor Studio, Contractor CRO Index 2026 (n=380 contractor sites, roofing + remodeling + HVAC)
Cite as: "Construction Industry Marketing Benchmark 2026: 380 Sites Scored." The Contractor CRO Index, Fervor Studio. 2026-05-22. Sample size: 380.
Construction industry marketing has three sub-pillars: CRO, SEO, and web design. Every channel a contractor pays for, from paid ads to organic search to social to referrals, eventually loads the same page. The website. That is where the lead either books or leaves, so a benchmark for construction industry marketing has to start where the conversion actually happens. We scored 380 contractor websites across three trades from 2026-05-10 to 2026-05-22, using the same Fervor Grade™ Framework on each brand. Roofing averaged 67.82 out of 100, remodeling 65.67, and HVAC 65.32. So the spread from the top trade to the bottom is small (2.5 points). The underlying category performance differs in instructive ways covered below.
Executive summary
Combined across 380 sites
Across all 380 sites, the combined mean Fervor Score is 66 of 100, a D on the standard school grading scale, and 85.5% grade at C or worse. That is the headline a stranger can quote. The per-trade breakdown is the drill-down: roofing took the lead by a margin small enough to read as noise. 2.5 Fervor Score points separate the top trade from the bottom. All three trades average in the D tier of the standard school grading scale, and none has reached B sample-wide. So the interesting story is not which trade is "better" online. It is what the three trades share. The two lowest-scoring categories in every trade are the same two, in the same order: Accessibility and Content & SEO. Same root cause, same remediation path. So if you build contractor websites, the floor of the trade you serve looks a lot like the floor of the others. And the ceiling does too.
What we found
Three findings worth sharing
- 01
The sample-wide problem is the same in all three trades. Accessibility and Content & SEO.
Accessibility, against WCAG 2.1 AA, is the lowest-scoring category in every trade: 48.6% of max for roofing, 45.4% for remodeling, and 43.8% for HVAC. Content & SEO is second-lowest in each: 70.3%, 63.9%, and 58.6%. So this is a contractor-website industry problem, not a trade-specific one.
- 02
Top performers exist in every trade.
Roofing's top brand earned a Fervor Score of 90. HVAC's top hit 90, and remodeling's was 86. Those are achievable benchmarks within each trade's competitive set. The gap isn't structural, it's executional. So if your site is sitting near the trade-sample median, the path to passing is a short list of fixes, not a rebuild.
- 03
The bottom tail is real.
Roofing has 31 F-graded brands (24% of the roofing trade sample) and 33 D-graded. Remodeling has 37 at F and 30 at D. And HVAC has 25 at F and 38 at D. These are sites with structural conversion failures. Not minor tweaks. Missing fundamentals. So if your site falls into one of those bands, the cheapest move is a Site Inspection.
The three reports
Three trades, one framework
State of
Roofing
- 130 sites inspected
- 70 median, range 30 to 90
- 19 at B or above, 64 at D or F
State of
Remodeling
- 146 sites inspected
- 71 median, range 3 to 86
- 24 at B or above, 67 at D or F
State of
HVAC
- 104 sites inspected
- 65 median, range 31 to 90
- 12 at B or above, 63 at D or F
02 / The full numbers
Every metric. Every trade compared. Every WCAG severity tier.
The receipts. From here down, the page lays out every measurement side by side across all three trades (roofing, remodeling, and HVAC). Each number traces to a screenshot, a DOM read, an axe-core 4.10.2 evaluation, or a Google Lighthouse 13.3.0 measurement, and reproduces against the per-trade reports.
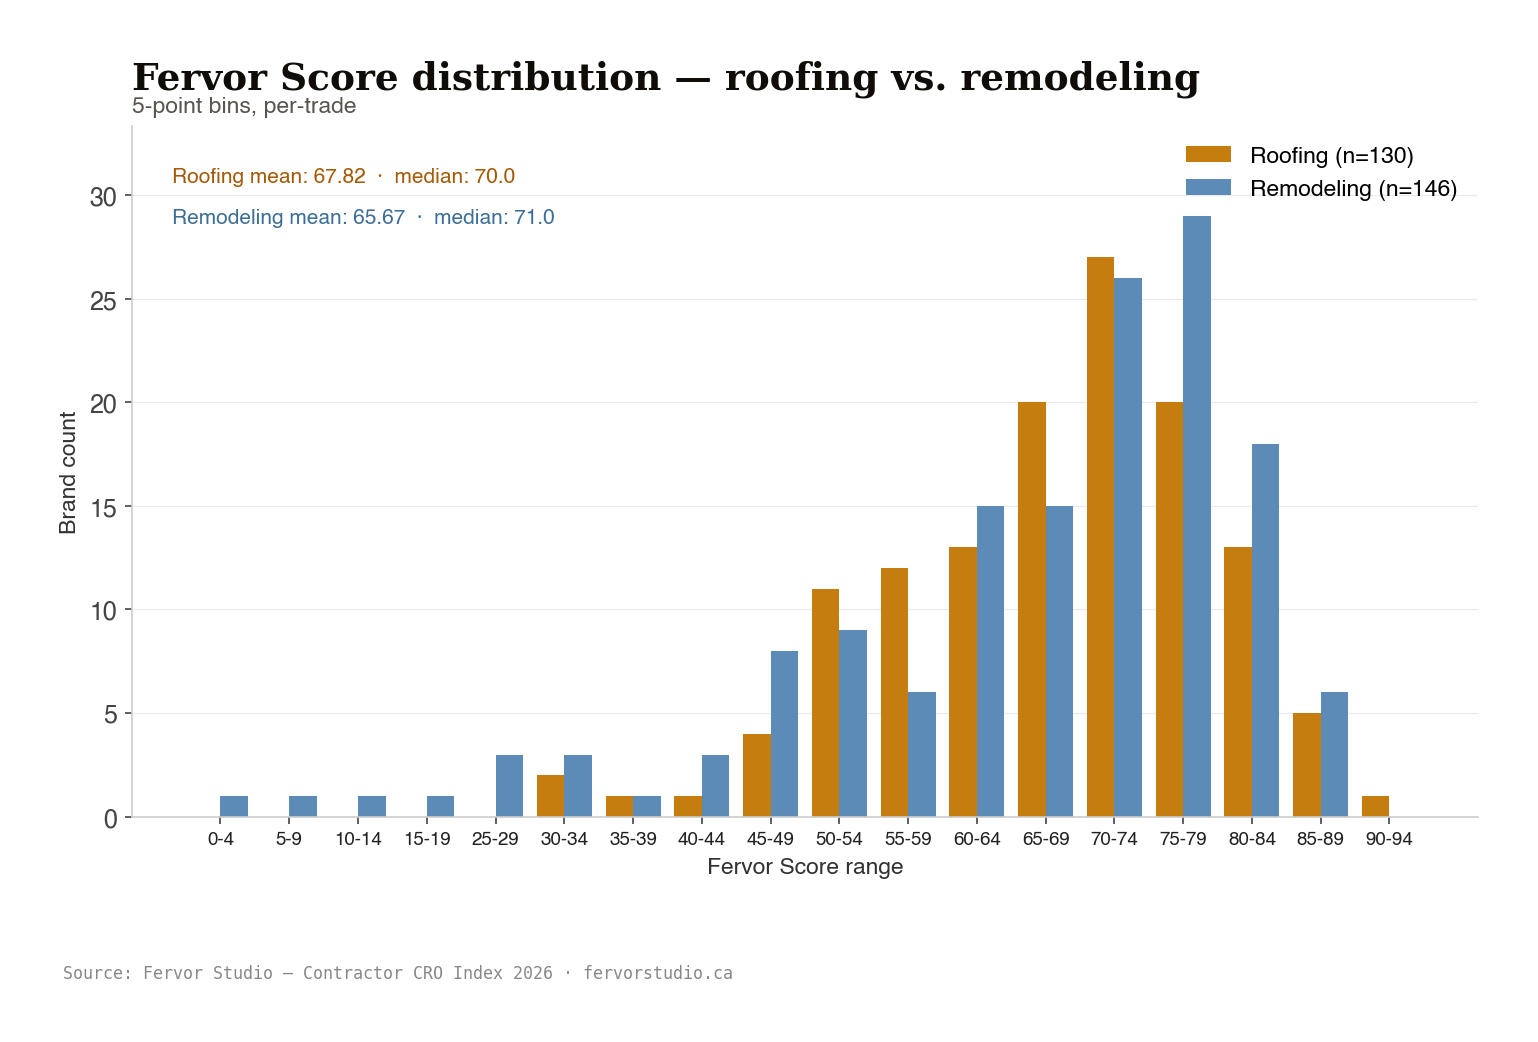
Score distribution, side by side
Per-trade Fervor Score distribution. Every number on this page comes from the cross-trade pipeline's pre-computed comparison, not from anything we aggregated at render time.
| Metric | Roofing (n=130) | Remodeling (n=146) | HVAC (n=104) |
|---|---|---|---|
| Fervor Score mean | 67.82 | 65.67 | 65.32 |
| Fervor Score median | 70 | 71 | 65 |
| Standard deviation (spread) | 11.83 | 16.68 | 11.02 |
| Highest observed | 90 | 86 | 90 |
| Lowest observed | 30 | 3 | 31 |
| Base Score mean (before grade adjustment) | 74.78 | 68.25 | 63.84 |
The Base Score is what the rubric returns on its own. The Fervor Score (the mean row) is the Adjusted Score, after Grade Adjustments. And those adjustments run in both directions. They hand partial credit back where the base rubric over-penalizes a trade-specific pattern, and they dock points where it under-weights a conversion-critical failure. So the net isn't fixed. It lands wherever each brand's evidence puts it. For roofing the adjustments net to roughly -7.0 points. For remodeling, -2.6. And for HVAC, +1.5. That's the one trade where, on balance, the base rubric ran a touch too harsh.

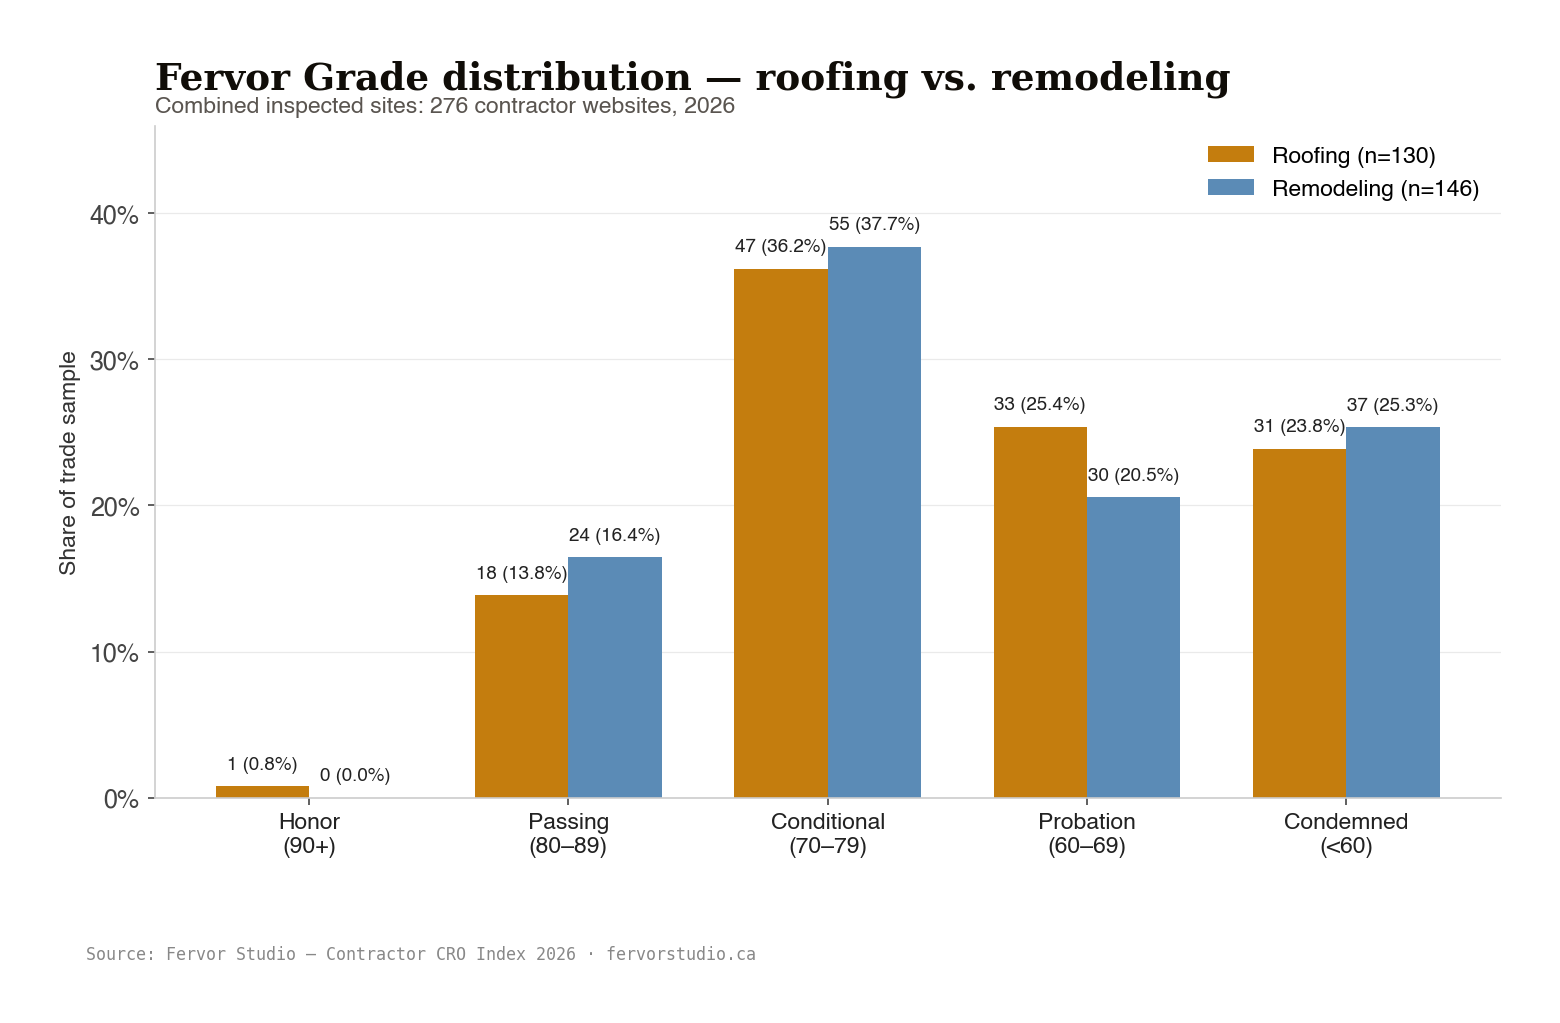
Fervor Grade distribution, side by side
Letter grade counts within each trade. The shape is consistent across all three trades. Most brands cluster in C or D, the long bottom tail is real (about a quarter of each trade graded F), and the A category is empty for remodeling and holds a single brand each in roofing and HVAC.
| Fervor Grade | Roofing count | Roofing share | Remodeling count | Remodeling share | HVAC count | HVAC share |
|---|---|---|---|---|---|---|
| Grade A (Honor, 90+) | 1 | 0.8% | 0 | 0.0% | 1 | 1.0% |
| Grade B (Passing, 80 to 89) | 18 | 13.8% | 24 | 16.4% | 11 | 10.6% |
| Grade C (Conditional, 70 to 79) | 47 | 36.2% | 55 | 37.7% | 29 | 27.9% |
| Grade D (Probation, 60 to 69) | 33 | 25.4% | 30 | 20.5% | 38 | 36.5% |
| Grade F (Condemned, under 60) | 31 | 23.8% | 37 | 25.3% | 25 | 24.0% |

Category-by-category comparison
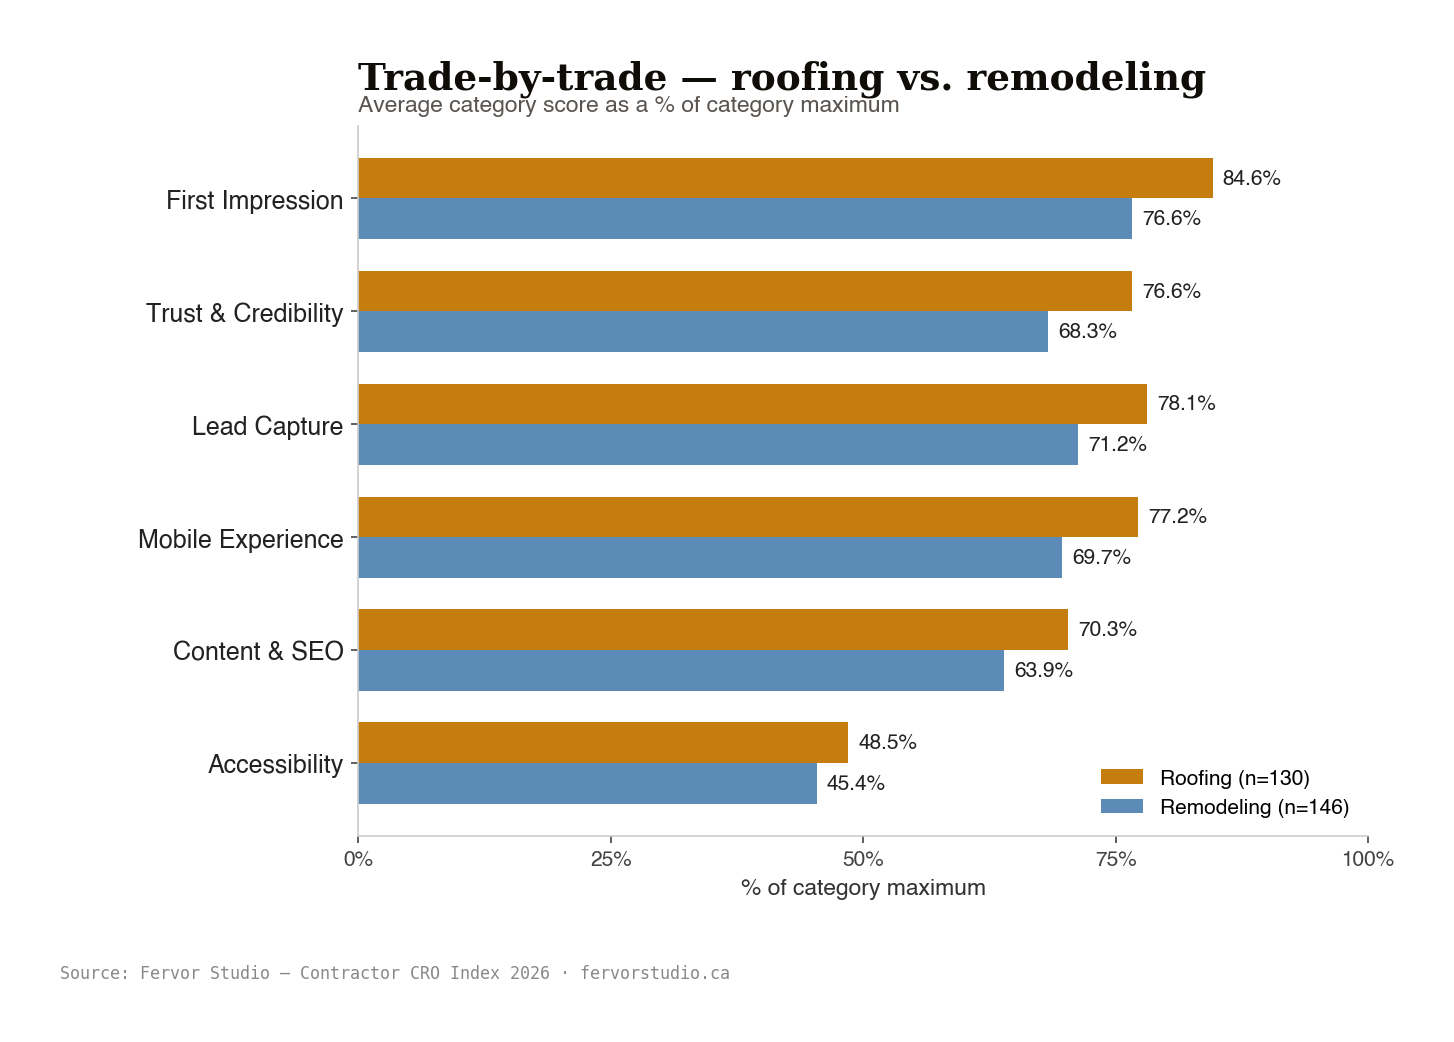
Each trade sample scored against the same six Fervor Grade categories. The percentage-of-max column shows how close each trade sample gets to a full score in that category. Roofing leads every category. The widest gaps are on First Impression and Lead Capture. The narrowest is on Accessibility, where all three trades sit in the red.
| Category | Roofing mean | Roofing % of max | Remodeling mean | Remodeling % of max | HVAC mean | HVAC % of max | Leader |
|---|---|---|---|---|---|---|---|
| First Impression | 16.92 / 20 | 84.6% | 15.33 / 20 | 76.6% | 14.00 / 20 | 70% | Roofing |
| Trust & Credibility | 16.85 / 22 | 76.6% | 15.03 / 22 | 68.3% | 13.97 / 22 | 63.5% | Roofing |
| Lead Capture | 15.62 / 20 | 78.1% | 14.25 / 20 | 71.2% | 12.71 / 20 | 63.6% | Roofing |
| Mobile Experience | 11.58 / 15 | 77.2% | 10.45 / 15 | 69.6% | 10.89 / 15 | 72.6% | Roofing |
| Content & SEO | 10.54 / 15 | 70.3% | 9.59 / 15 | 63.9% | 8.79 / 15 | 58.6% | Roofing |
| Accessibility | 3.88 / 8 | 48.6% | 3.63 / 8 | 45.4% | 3.50 / 8 | 43.8% | Roofing |

Accessibility
Accessibility scores reflect the page's default state. What a visitor encounters when they land. Third-party accessibility overlay widgets (AccessiBe, UserWay, EqualWeb, AudioEye, and similar) are not credited toward a brand's accessibility Fervor Score. This aligns with the WebAIM and 700-plus accessibility expert position (the Overlay Fact Sheet), DOJ guidance, and U.S. case law in the Robles v. Domino's lineage. Overlays are opt-in, most visitors don't activate them, and they don't satisfy the ADA.
Empirical overlay census, 2026-05-12. We made a direct HTTPS GET against each brand's homepage with a Chrome 120 user agent and looked through the response for the named overlay vendors (9 of them in total). One caveat on the counts below: this census ran against each trade's sample as it stood on 2026-05-12, which isn't the same as the published trade samples (130 roofing and 146 remodeling) those trade samples grew or shrank into by publication. Roofing: 132 homepages in that day's sample, 115 returned HTML (87.1%), 7 with an overlay (5.3%, made up of 4 AudioEye, 2 UserWay, 1 AccessiBe). Remodeling: 107 homepages, 102 returned HTML (95.3%), 3 with an overlay (2.8%, made up of 2 AccessiBe, 1 UserWay). Combined: 10 of 239 homepages across both day samples (4.2%). Worst-case bounds, assuming every unfetched brand carried an overlay: roofing tops out at 18.2%, remodeling at 7.5%. The HVAC trade sample wasn't re-scanned, so it sits outside this overlay census. Either way, overlays earn no Fervor Score credit, so the count doesn't move any brand's grade.
Why overlay widgets don't earn credit
Three pieces of receipts that explain why an installed overlay doesn't satisfy the ADA, and doesn't earn a brand any Fervor Grade™ credit in this report:
"The Ninth Circuit held that Title III of the ADA applies to a business's website and mobile app when those have a nexus to a physical place of public accommodation. In October 2019 the Supreme Court declined review, leaving the Ninth Circuit decision intact and exposing brick-and-mortar businesses nationwide to website-accessibility lawsuits."
Robles v. Domino's Pizza LLC, 913 F.3d 898 (9th Cir.) (2019)
"A blind plaintiff sued Eyebobs over website inaccessibility despite the site running an accessiBe overlay. The case settled by consent decree requiring the U.S. portion of the website be made accessible within three years (with provision for extensions to four or five years), plus an accessibility coordination team, a published accessibility policy, regular reviews, training, and retention of an accessibility consultant."
Murphy v. Eyebobs LLC, W.D. Pa. (2021)
"The FTC's final order requires accessiBe to pay $1 million and bars the company from representing that its automated product can make any website WCAG-compliant or can ensure continued WCAG compliance over time, unless it has evidence to support such claims."
FTC Approves Final Order Requiring accessiBe to pay $1 Million, Federal Trade Commission (2025)
The aggregate stats on this page are mechanical and reproducible from the per-trade JSON files behind State of Roofing, State of Remodeling, and State of HVAC.
Methodology terms
The shared vocabulary this report (and the per-trade reports) lean on. Lifted from the canonical methodology appendix.
- Contractor CRO Index
- The Site Inspection program. The live index of contractor websites scored via Site Inspection.
- Site Inspection
- An individual brand's Site Inspection. Combines screenshot review of every homepage, service, location, and contact page across mobile and desktop, structured DOM extraction (phone numbers, schema markup, form fields, credentials), accessibility evaluation using axe-core (WCAG 2.1 AA compliance check), Core Web Vitals via Google Lighthouse, and call-to-action click-through verification.
- Fervor Grade™ Framework
- A 100-point, 6-category framework for evaluating contractor websites on the dimensions that drive lead generation and conversion. Each Site Inspection produces a Fervor Score (numeric, 0 to 100) which maps to a Fervor Grade (letter, A to F) using standard school grading thresholds. A 90 or above is Honor. 80 to 89 is Passing. 70 to 79 is Conditional. 60 to 69 is Probation. Under 60 is Condemned. Categories are weighted. First Impression 20 points. Trust & Credibility 22. Lead Capture 20. Mobile Experience 15. Content & SEO 15. Accessibility 8.
- Fervor Score
- A brand's numeric Site Inspection result on the 0 to 100 scale. The Adjusted Score is after Grade Adjustments. The Base Score is the framework output before adjustments.
- Fervor Grade
- The letter grade A through F derived from a brand's Fervor Score using the standard school grading thresholds.
- Grade Adjustment
- A post-framework correction applied to a brand's Base Score when contextual factors warrant it. Example. A brand running a 24/7 emergency service gets a partial Grade Adjustment if their phone number isn't visible above the fold (the standard framework penalty is heavier than the actual conversion impact for their trade). The Adjusted Score, the final Fervor Score, equals Base Score plus the sum of Grade Adjustment deltas.
- axe-core
- Open-source accessibility tool maintained by Deque Systems. Reads the rendered HTML, CSS, and JavaScript of a webpage and reports violations of WCAG 2.1 at the AA conformance level. Version 4.10.2 used here. Detects issues like missing alt text on images, insufficient color contrast, keyboard-trap navigation, and missing form labels.
- WCAG 2.1 AA
- Web Content Accessibility Guidelines 2.1, Level AA. The accessibility standard the U.S. Department of Justice references when applying the ADA to commercial websites. Failure to meet AA is the basis for accessibility lawsuits under Title III of the ADA.
- Google Lighthouse Core Web Vitals
- Google's open-source page-quality tool. Measures Largest Contentful Paint (when the main content appears), Cumulative Layout Shift (how much the page jumps around during load), Total Blocking Time (how long the page is unresponsive to clicks), and the overall Performance score. Google uses these metrics as ranking signals in search results.
- DOM facts
- Structured data extracted from a page's rendered DOM at capture time. schema.org JSON-LD markup, tel and mailto links, form field structures, social-media link patterns, manufacturer and certification badges in body text, review widget signatures, alt text on images, and chat-widget presence. A mechanical second source of truth alongside the visual screenshot.
Citation
"Construction Industry Marketing Benchmark 2026: 380 Sites Scored." The Contractor CRO Index, Fervor Studio. 2026-05-22. Sample size: 380. Methodology: Fervor Grade™ Framework.
Short form: (Contractor CRO Index, Fervor Studio, 2026)
| Field | Value |
|---|---|
| Publisher | Fervor Studio · fervorstudio.ca |
| Report ID | SoI-Cross-Trade-2026 |
| Published | 2026-05-22 |
| Data collection window (combined) | 2026-05-10 to 2026-05-22 |
| Data collection window (per trade) | roofing 2026-05-10 to 2026-05-16, remodeling 2026-05-11 to 2026-05-15, and HVAC 2026-05-19 to 2026-05-22 |
| Sample size | 380 (130 roofing, 146 remodeling, 104 HVAC) |
Editorial use policy
The dataset is published under Creative Commons Attribution-NonCommercial 4.0. The non-commercial clause is narrower than it sounds, so here is the plain-English version that governs how the numbers can travel.
Editorial, journalistic, and content-marketing use is welcomed and encouraged, including on agency, contractor, and competitor blogs, with attribution to Fervor Studio. The non-commercial clause targets direct resale, paid newsletters, paywalled research, paid client deliverables, and inclusion in commercial SaaS products. If you're publishing about the data on a blog or in a story, you're covered. If you're packaging it into something a customer pays for, contact Fervor Studio for permission.
Frequently asked questions
Quick answers about how roofing, remodeling, and HVAC contractor websites compare under the Fervor Grade Framework. Every answer cites the underlying primary research or, for third-party claims, the original publisher.
What is construction industry marketing?
Construction industry marketing is the umbrella for every channel that drives leads to a contractor business: CRO, SEO, web design, paid media, reputation management, and referral systems. Every channel eventually delivers traffic to the same place, the website, which is why this benchmark scores the website pillar first. The conversion floor the website creates is what the rest of the construction industry marketing stack relies on.
Source: Fervor Studio, Contractor CRO Index 2026 (n=380 contractor sites, roofing + remodeling + HVAC)
What is the Contractor CRO Index?
The Contractor CRO Index is Fervor Studio's annual benchmark of contractor websites in North America, covering general contractor marketing across the building envelope and home improvement marketing across residential remodeling. We inspected 380 sites in 2026, 130 roofing brands, 146 remodeling brands, and 104 HVAC brands, against the same 100-point framework. Every score traces back to a captured screenshot, a read of the page, an axe-core 4.10.2 accessibility check, and Google Lighthouse 13.3.0 Core Web Vitals.
Source: Fervor Studio, Contractor CRO Index 2026 (n=380 contractor sites, roofing + remodeling + HVAC)
How do roofing, remodeling, and HVAC contractor websites compare?
Roofing leads on average at 67.82, with remodeling at 65.67 and HVAC at 65.32. So the spread is just 2.5 points, and all three land in the D (Probation) tier of the standard school grading scale. Roofing leads every category, but the gap between trades is small. Accessibility and Content & SEO are the two lowest-scoring categories in all three.
Source: Fervor Studio, Contractor CRO Index 2026 (n=380 contractor sites, roofing + remodeling + HVAC)
Which trade has the most sites at A or B grade?
Remodeling has 24 brands at B or above (16% of the remodeling trade sample). Roofing has 19 (15%). HVAC has 12 (12%). Roofing and HVAC each hold one of the two A grades in the combined sample. And all three trades carry most of their mass in C or below.
Source: Fervor Studio, Contractor CRO Index 2026 (n=380 contractor sites, roofing + remodeling + HVAC)
Where does each trade lose the most points?
Accessibility, for all three. Roofing scores 48.6% of the accessibility max, remodeling 45.4%, and HVAC 43.8%. Content & SEO is second-weakest in every trade. None has reached even 80% of the accessibility max sample-wide. Same root cause, same remediation path.
Source: Fervor Studio, Contractor CRO Index 2026 (n=380 contractor sites, roofing + remodeling + HVAC)
How many contractor websites have critical accessibility violations?
Across all three trades: 60.8% of roofing brands, 59.6% of remodeling brands, and 64.4% of HVAC brands carry at least one critical WCAG 2.1 AA violation across the pages we captured. We checked every page with axe-core 4.10.2. Critical violations are the kind ADA Title III plaintiffs cite in lawsuits, including Robles v. Domino's Pizza (9th Cir. 2019).
Source: axe-core 4.10.2 (WCAG 2.1 AA), Fervor Studio, Contractor CRO Index 2026 (n=380 contractor sites, roofing + remodeling + HVAC)
What is the average mobile page load speed?
Mobile LCP averages about 11.23s on a roofing homepage, 10.16s on remodeling, and 8.35s on HVAC. Google's threshold for "good" is 2.5s. Over 4s is "poor." All three trades sit deep in Google's poor band on mobile. Google's page-experience guidance confirms Core Web Vitals are a ranking signal.
Source: Google Lighthouse 13.3.0 (mobile), Fervor Studio, Contractor CRO Index 2026 (n=380 contractor sites, roofing + remodeling + HVAC)
Why does roofing lead every category?
Roofing has run on a phone-driven, emergency-call business model for longer than the modern web. The category leans heavily on visible phone numbers, fast page loads, and clear trust signals, which is most of what the framework measures. HVAC runs a similar emergency model but loses ground on speed and structured data. And remodeling sites lean more on portfolio depth, design polish, and longer consideration cycles. The framework weights every trade the same, so the operational habits of the roofing trade map closest to what it measures.
Source: Fervor Studio, Contractor CRO Index 2026 (n=380 contractor sites, roofing + remodeling + HVAC)
What is a Fervor Grade?
Fervor Grade is the letter grade (A through F) Fervor Studio assigns each contractor website on a 100-point scoring framework. A 90 or above is Honor. 80 to 89 is Passing. 70 to 79 is Conditional. 60 to 69 is Probation. Under 60 is Condemned. Same scale your kids get report cards on. The grade boils a 150-measurement Site Inspection down into one letter a contractor can act on.
Source: Fervor Studio, Contractor CRO Index 2026 (n=380 contractor sites, roofing + remodeling + HVAC)
How does Fervor Studio score contractor websites?
Same process on every brand. We capture screenshots at desktop and mobile width across every page our crawler can reach. We read the underlying page (forms, structured markup, phone and email links, badges, widgets). We run axe-core 4.10.2 against WCAG 2.1 AA. And we measure Core Web Vitals with Google Lighthouse 13.3.0. About 150 individual measurements per page. The 100-point Fervor Grade Framework then scores what we captured.
Source: Fervor Studio, Contractor CRO Index 2026 (n=380 contractor sites, roofing + remodeling + HVAC)
Where can I cite this report?
Use this citation: "Construction Industry Marketing Benchmark 2026: 380 Sites Scored." The Contractor CRO Index, Fervor Studio. 2026-05-22. Sample size: 380. Short form: (Contractor CRO Index, Fervor Studio, 2026). The full per-trade detail and methodology lives at the linked per-trade reports above.
Source: Fervor Studio, Contractor CRO Index 2026 (n=380 contractor sites, roofing + remodeling + HVAC)


Want to know how good your contractor website is?
Every Site Inspection runs the same framework and evidence captures as the 380 brands across these three trades. Start with a free Site Inspection, or read the per-trade reports for roofing, remodeling, and HVAC.