Contractor CRO Index · State of HVAC · 2026
Digital State of the HVAC Industry 2026104 Contractor Websites Scored
Between 2026-05-19 and 2026-05-22, Fervor Studio ran Site Inspections on 104 HVAC contractor websites across the US and Canada. Same framework, same scoring. 100 points across six categories, axe-core 4.10.2 for accessibility, and Google Lighthouse 13.3.0 for Core Web Vitals. Fervor's newsroom broke these findings down in Best HVAC CRO Agencies in 2026, Best HVAC Marketing Agencies in 2026, Best HVAC SEO Companies in 2026, Best HVAC Software in 2026: Eleven Ranked Across Three Classes, Best HVAC Websites in 2026, BuildOps Review 2026: Pricing, Contract Terms and Alternatives, HVAC Maintenance Plan Website: The Upsell 2 in 3 Surface, HVAC Online Scheduling: The 43% Losing After-Hours Bookings, HVAC Website ADA Compliance: The 64.4% That Fail the Audit, and HVAC Website Conversion: Where 26% of Sites Lose the Call. Every figure here also feeds the CRO Index statistics.

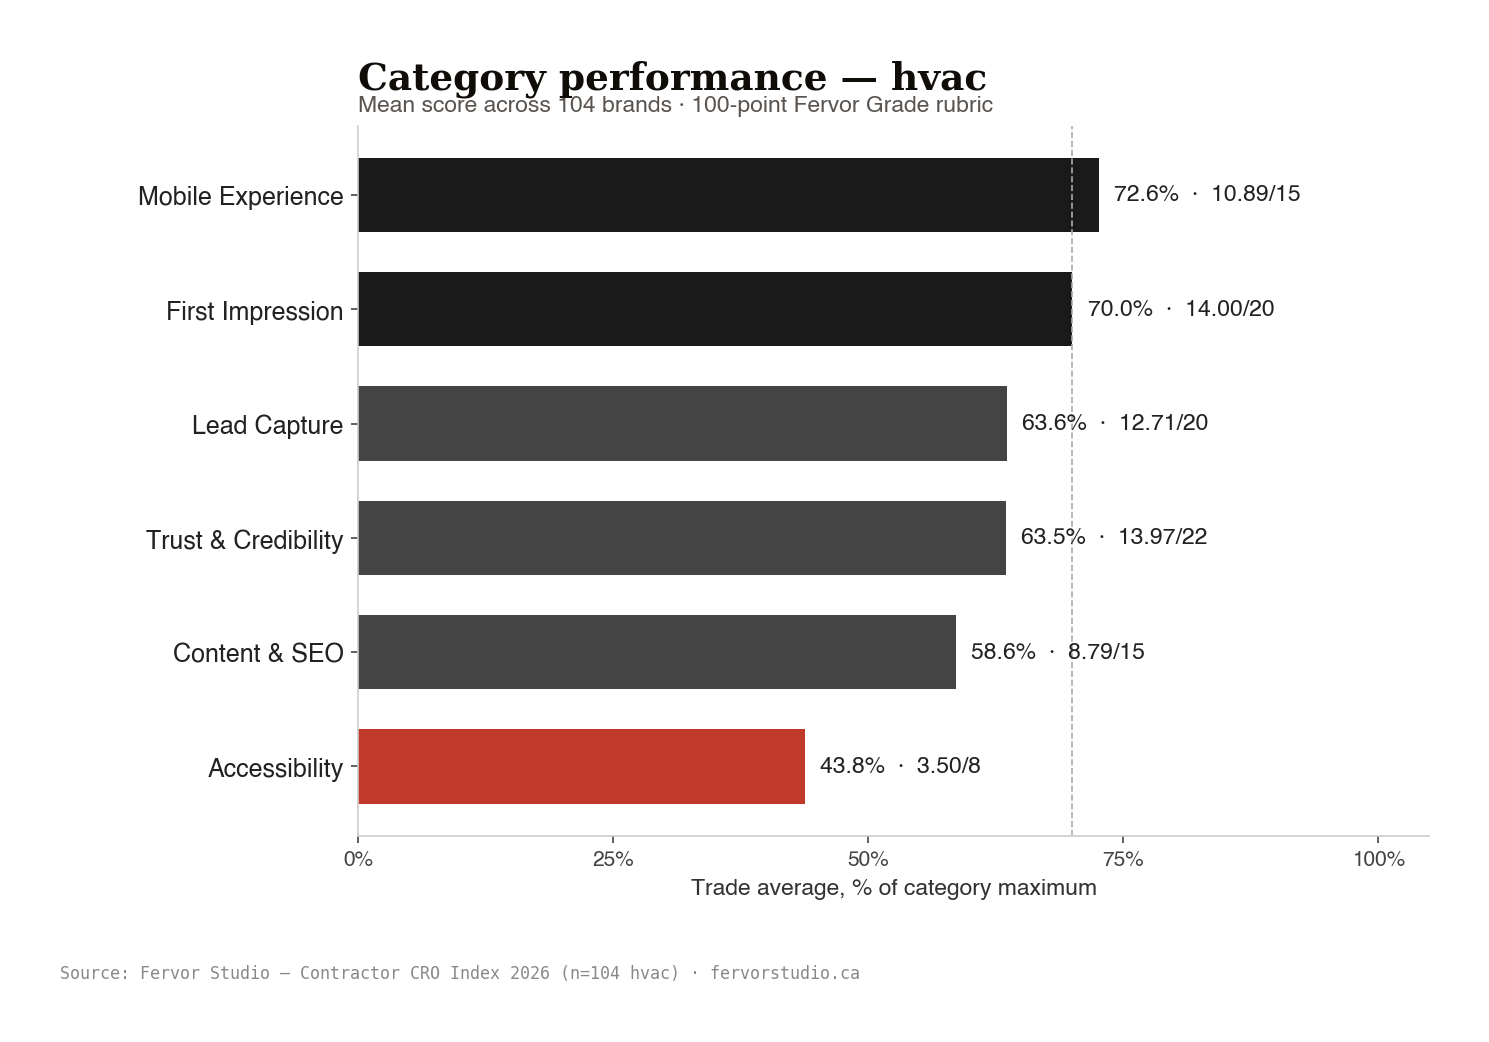
Mean category score · 104 HVAC brands · 2026
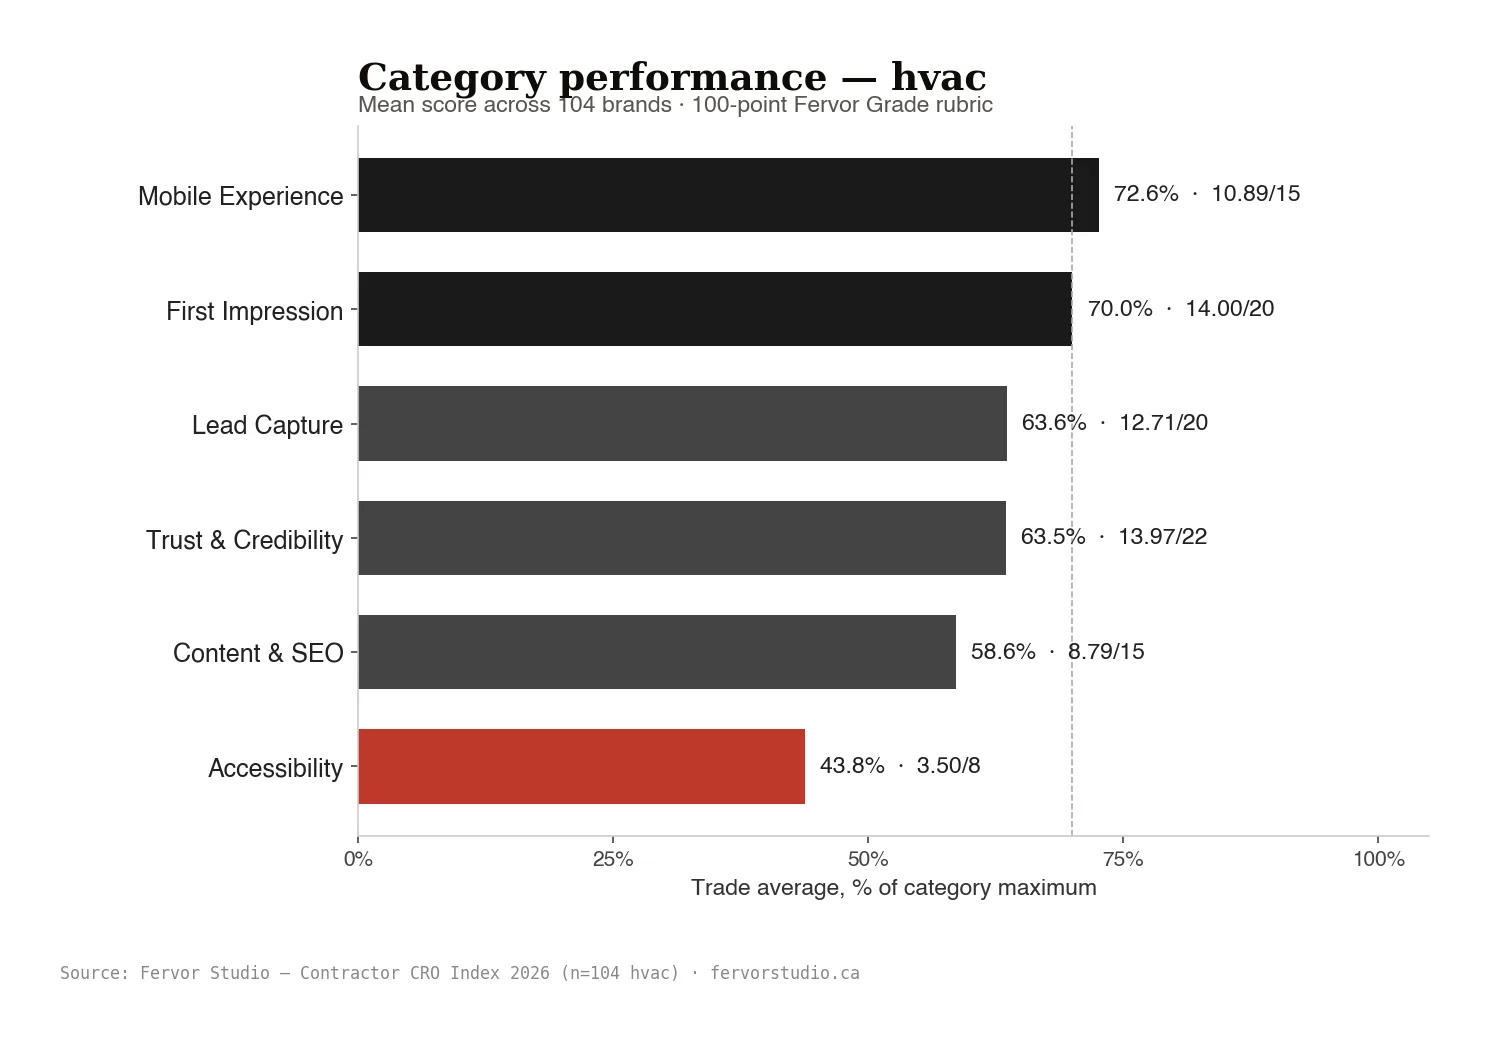
Mean score per category across 104 HVAC brands.
HVAC is a phone-first trade with a speed problem.
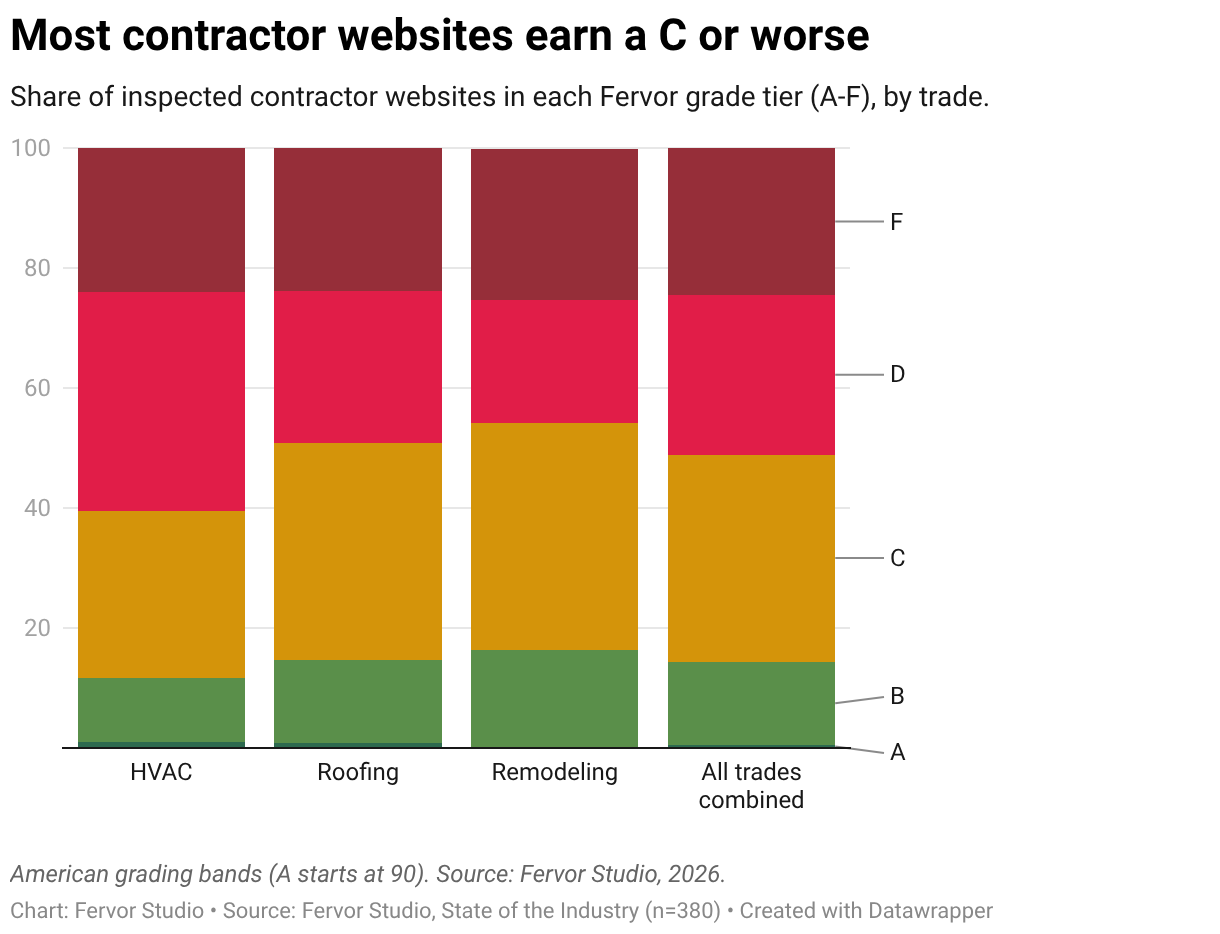
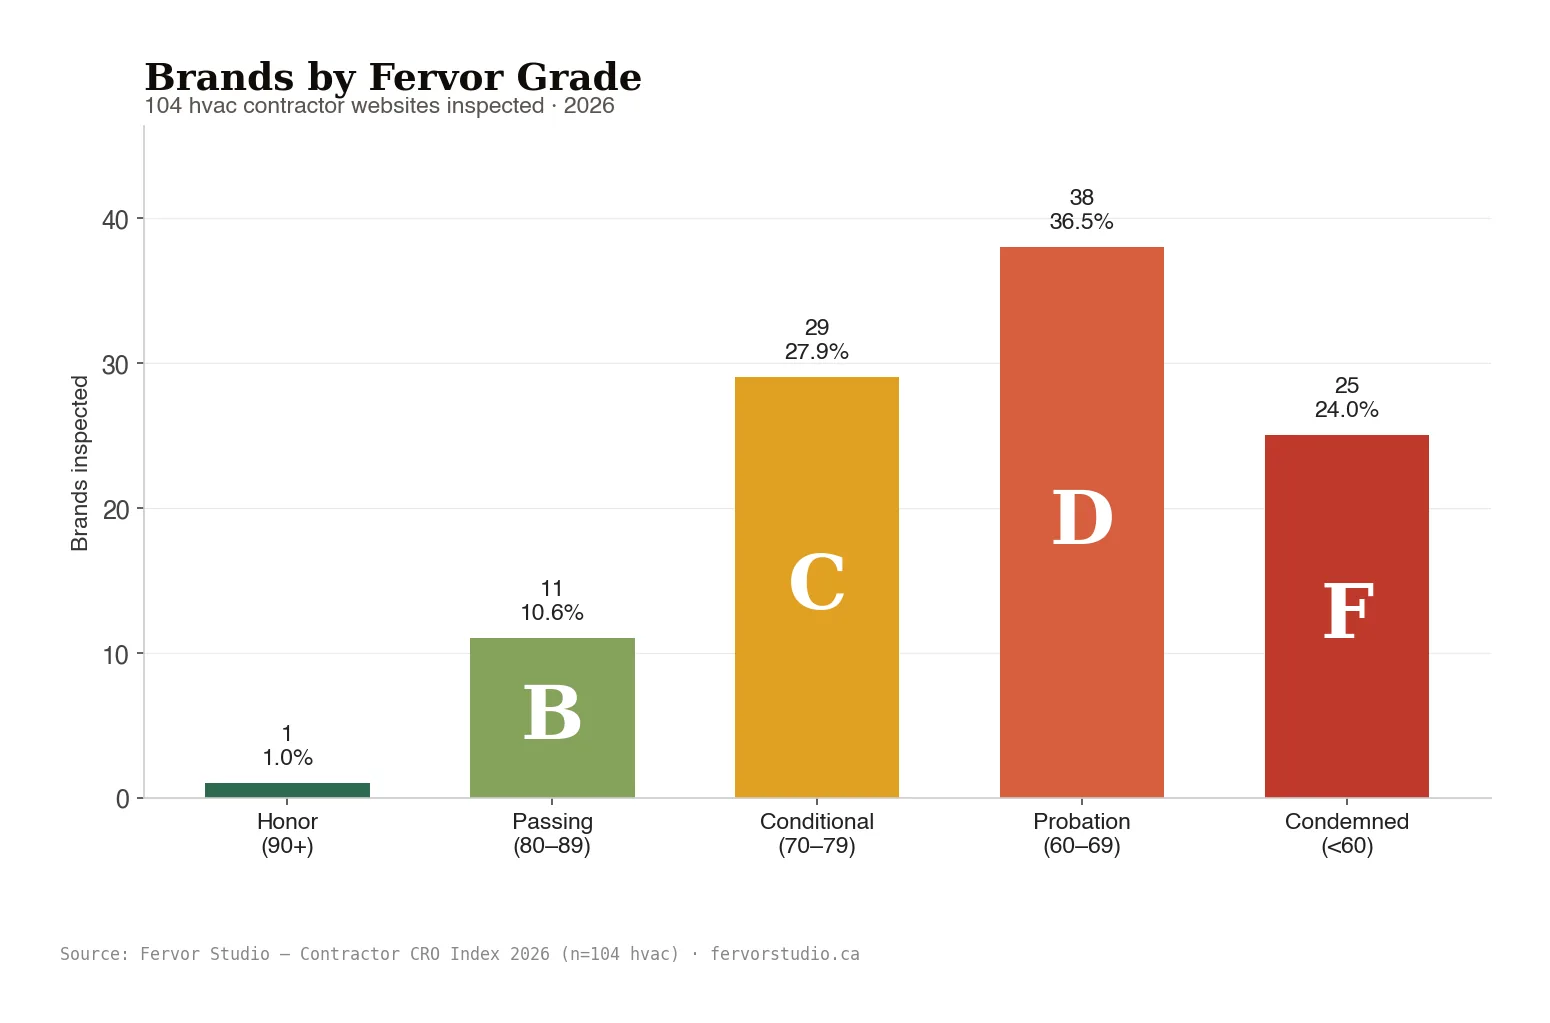
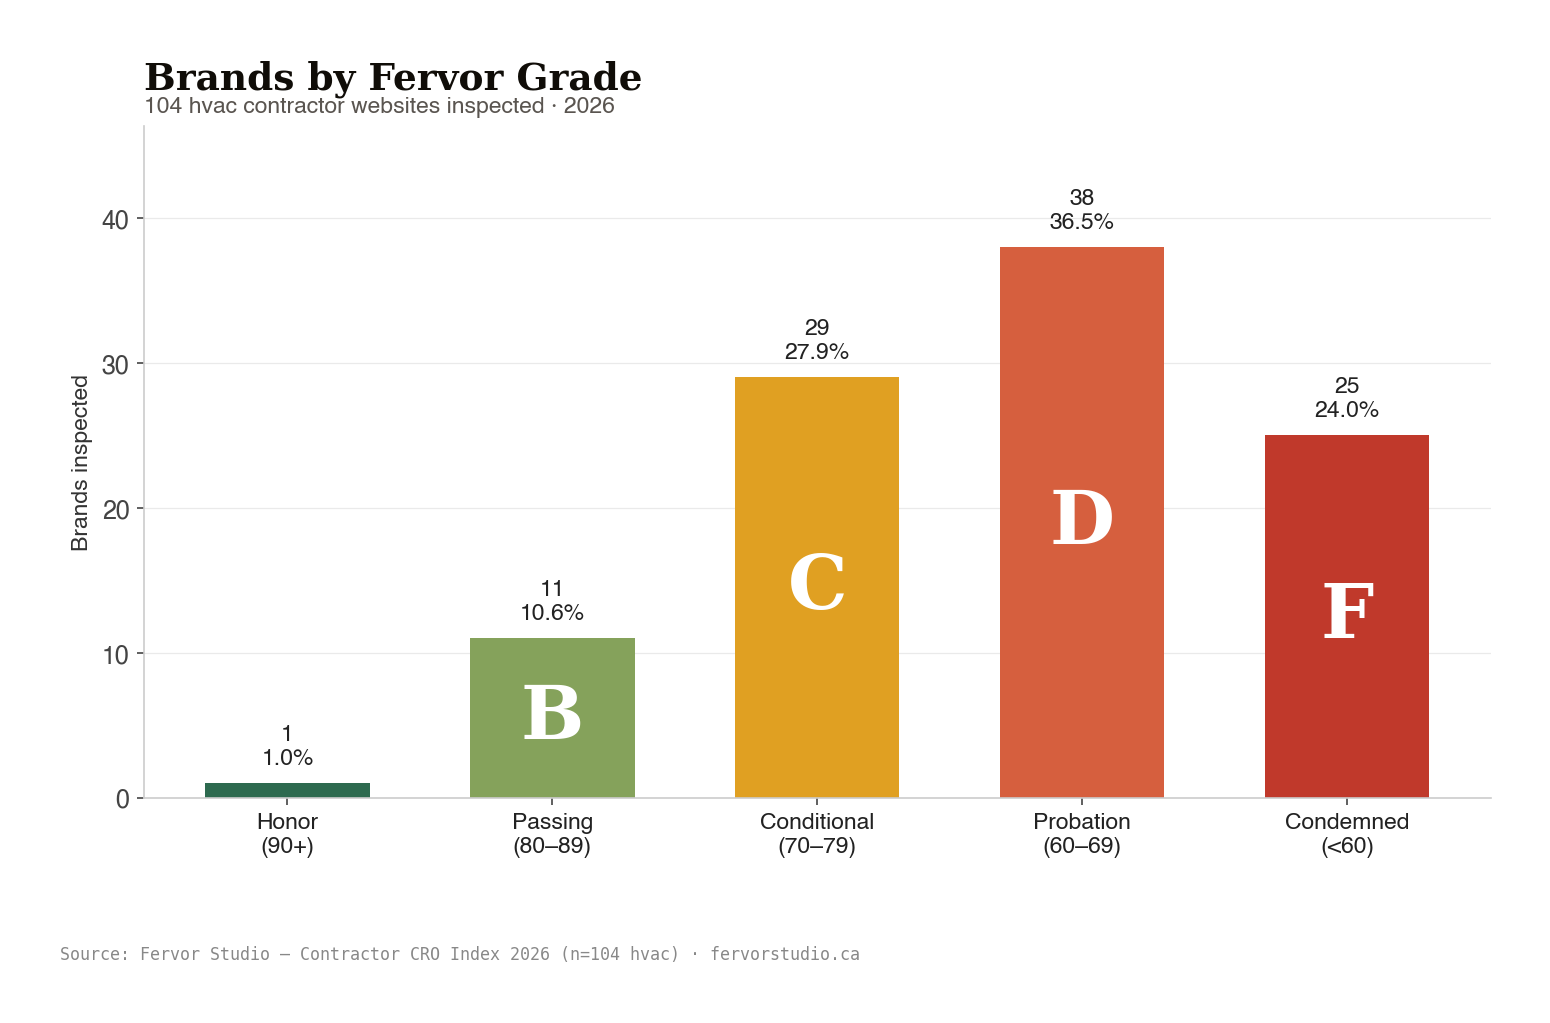
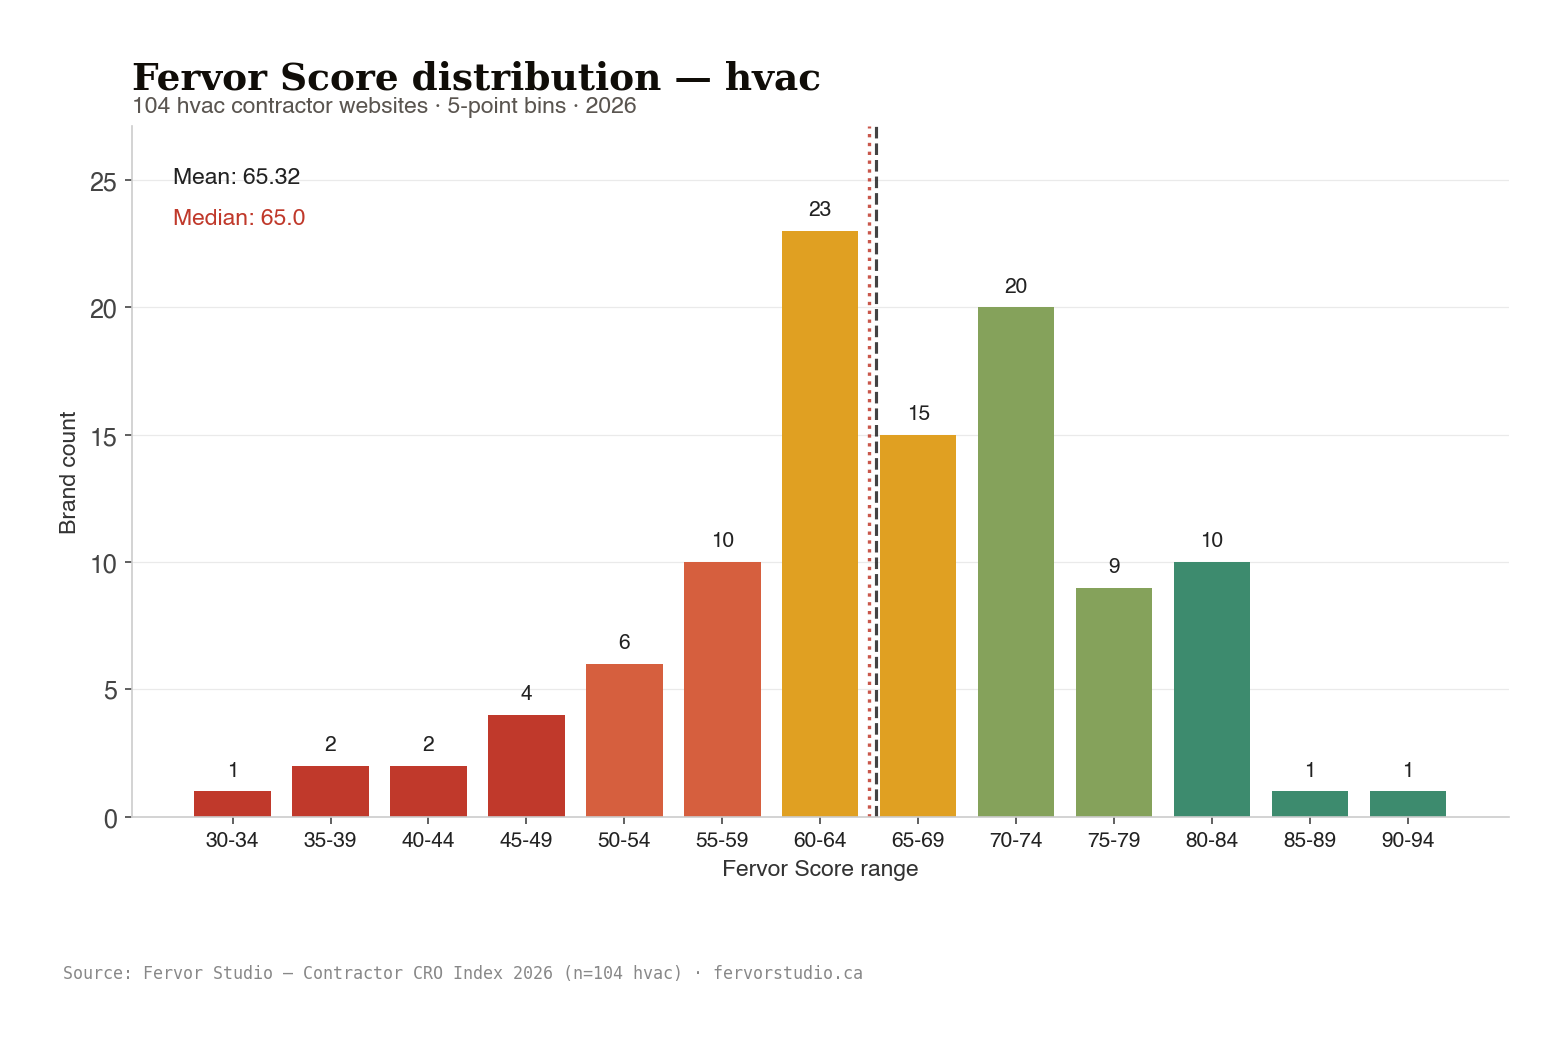
The trade averaged 65.32/100, which lands a D on standard school grading thresholds. Median 65. 1 of 104 brands earned an A. 25 earned an F. The middle of the distribution is where the addressable opportunity sits.
HVAC leads the trade comparison on the phone-first basics. 74% of brands put a clickable phone number in the persistent header, the highest adoption rate of any conversion signal we measured. 56.7% run a real online-scheduling tool. The parts of the website a homeowner with a dead furnace at midnight actually needs are mostly there.
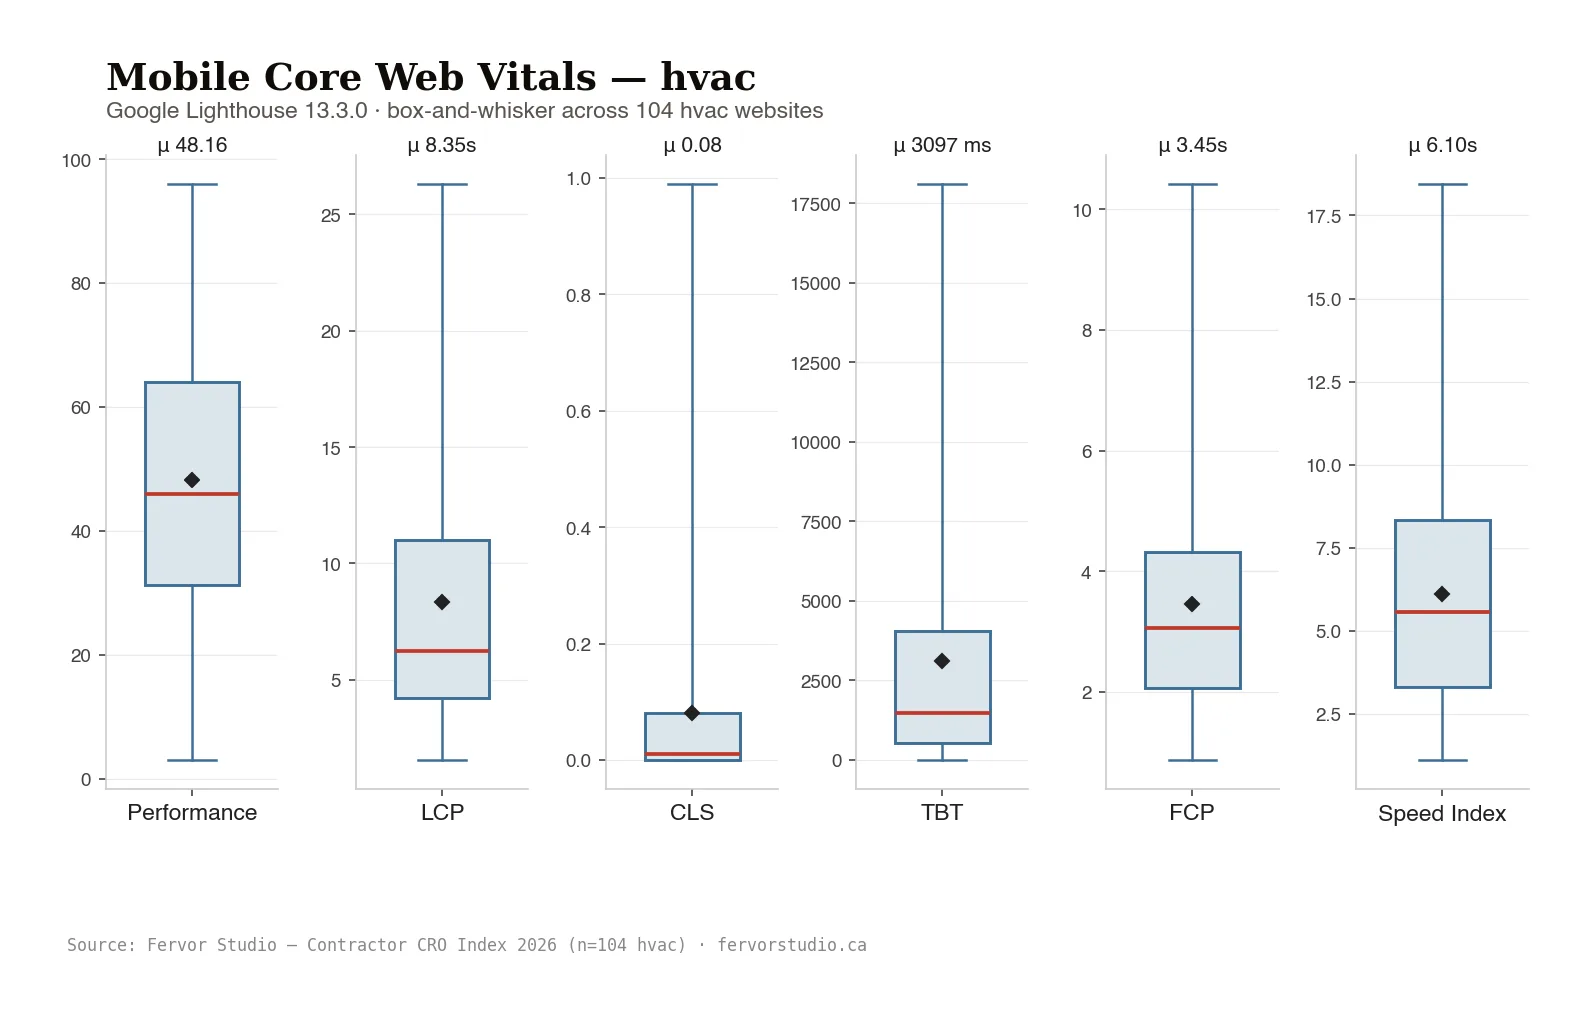
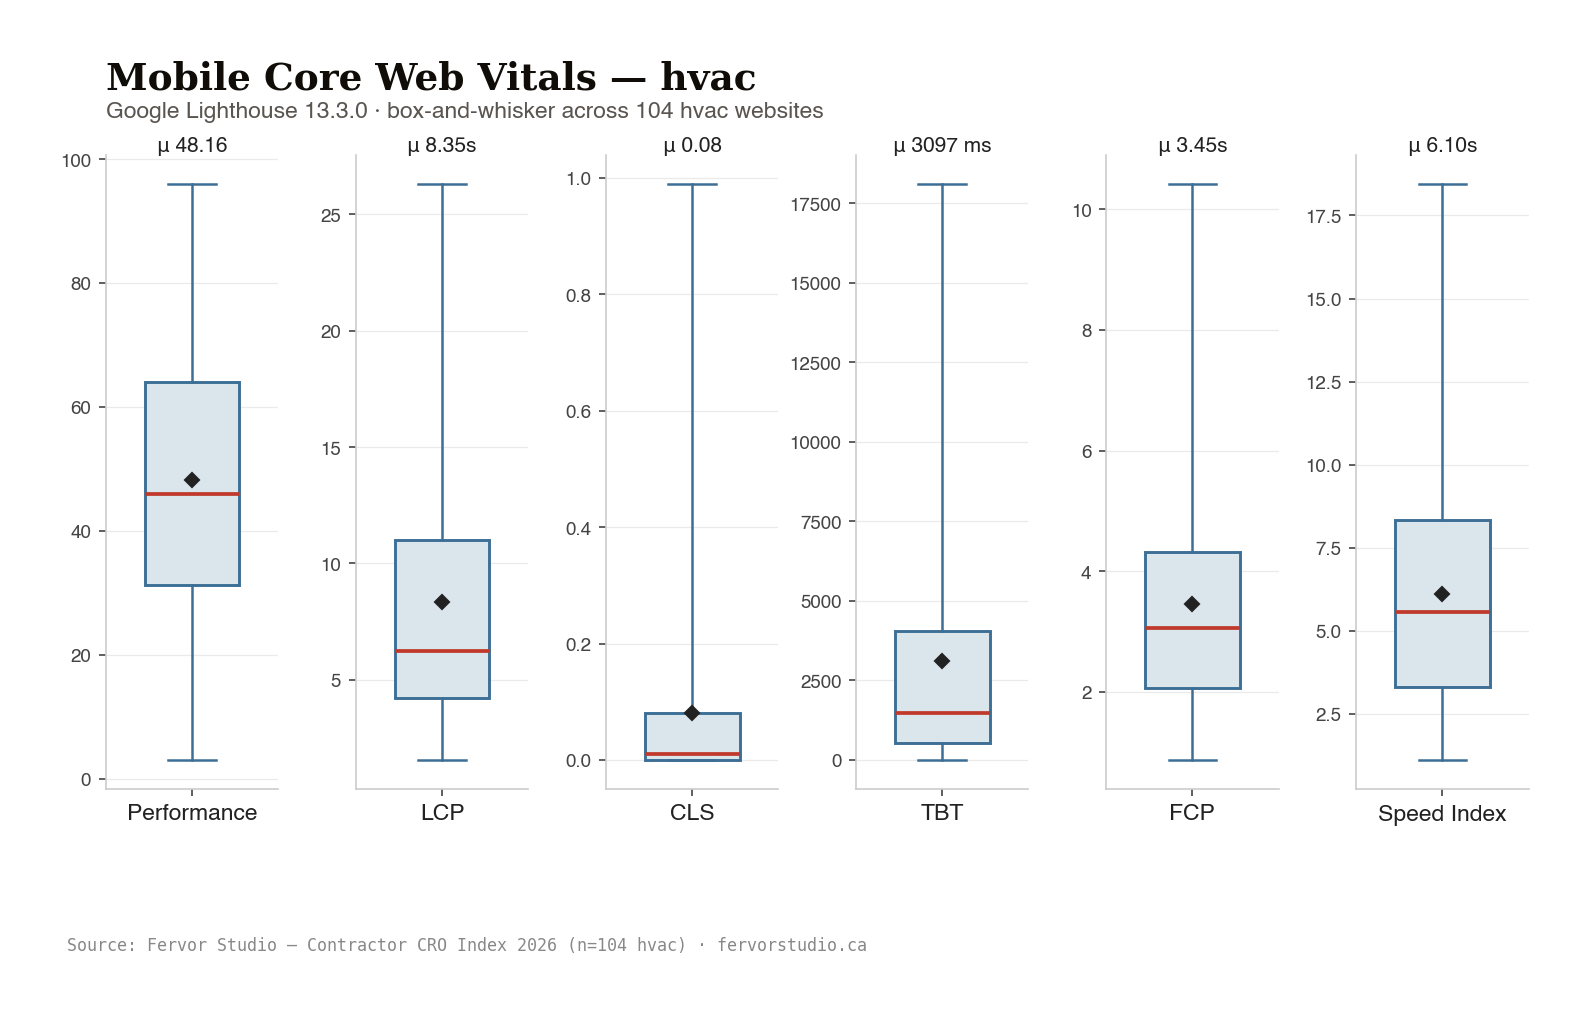
Site speed is where the trade falls behind. Mean mobile LCP is 8.35s. Google's threshold for "good" is 2.5s. Heavy hero photography + uncompressed background videos.
What we found
Five findings from the 2026 HVAC trade sample
Five things stood out across the 104 HVAC brands we scored. Each is mechanical, sourced from the captured DOM facts or Lighthouse measurements on each brand. No per-brand callouts in this report. The pattern is what matters.
- 01
The phone-first basics are mostly there.
74% put a clickable phone number in the persistent header (77 of 104 brands). The strongest-adoption conversion signal in the trade.
- 02
Mobile pages are slow.
Mean mobile LCP is 8.35s versus Google's 2.5s "good" threshold. Heavy hero photography + uncompressed background videos.
- 03
Online scheduling is mainstream but not universal.
56.7% of HVAC brands run a real online-scheduling tool. 43% still ask homeowners to call during business hours.
- 04
Maintenance-plan upsells are visible on two-thirds of sites.
67.3% of HVAC brands name a tune-up or maintenance plan on the public site. The most reliable margin path in the trade.
- 05
Structured-data adoption is shallow.
88.5% of HVAC brands publish some JSON-LD structured data, but most stop at
OrganizationorLocalBusiness.
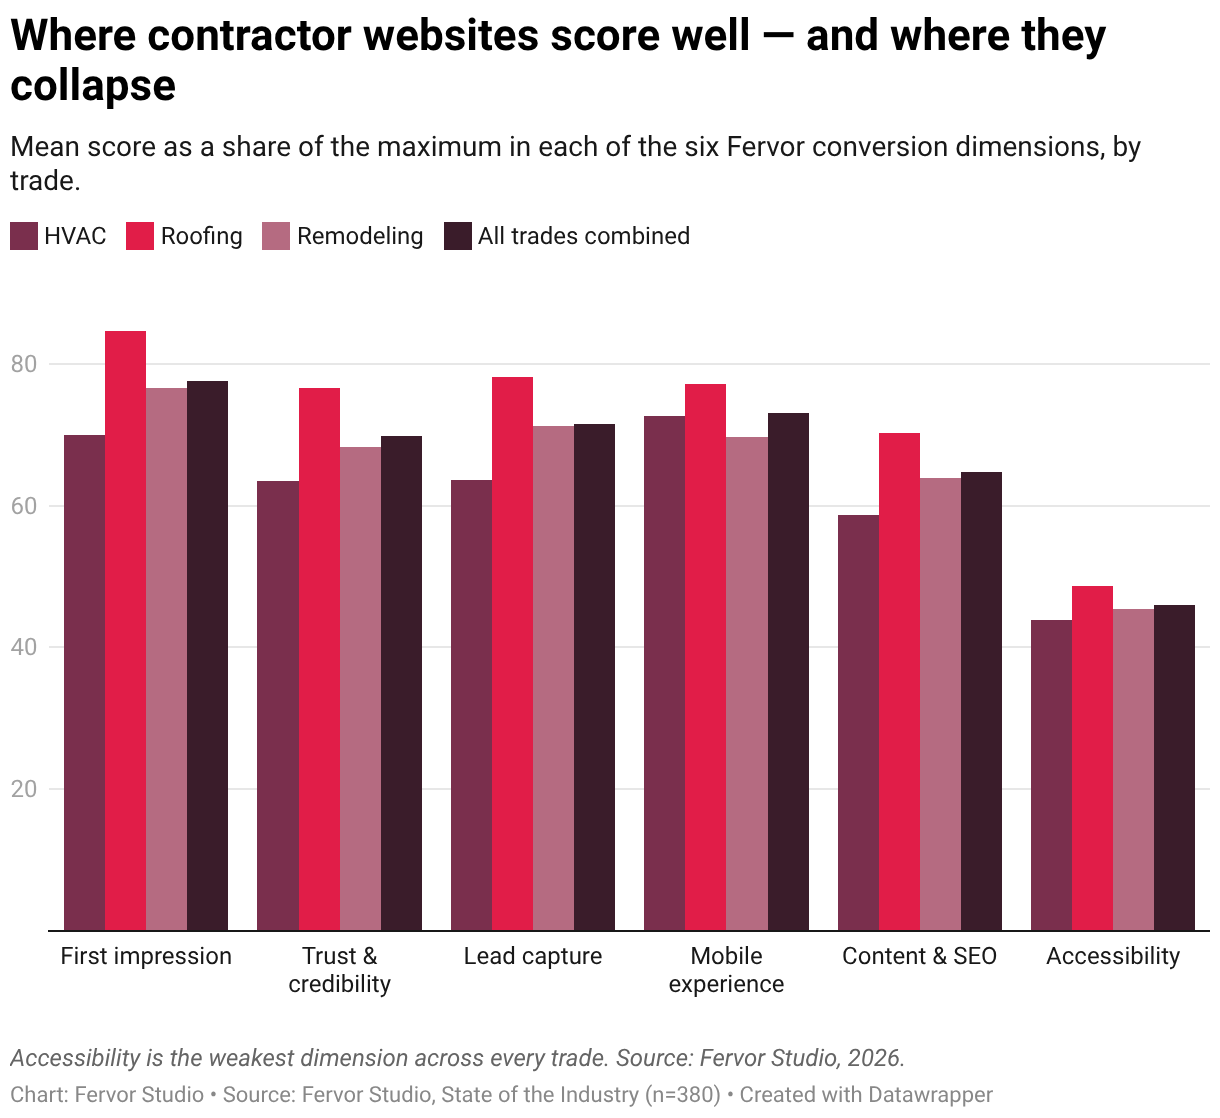
Top quartile vs bottom quartile
Where the gap is biggest
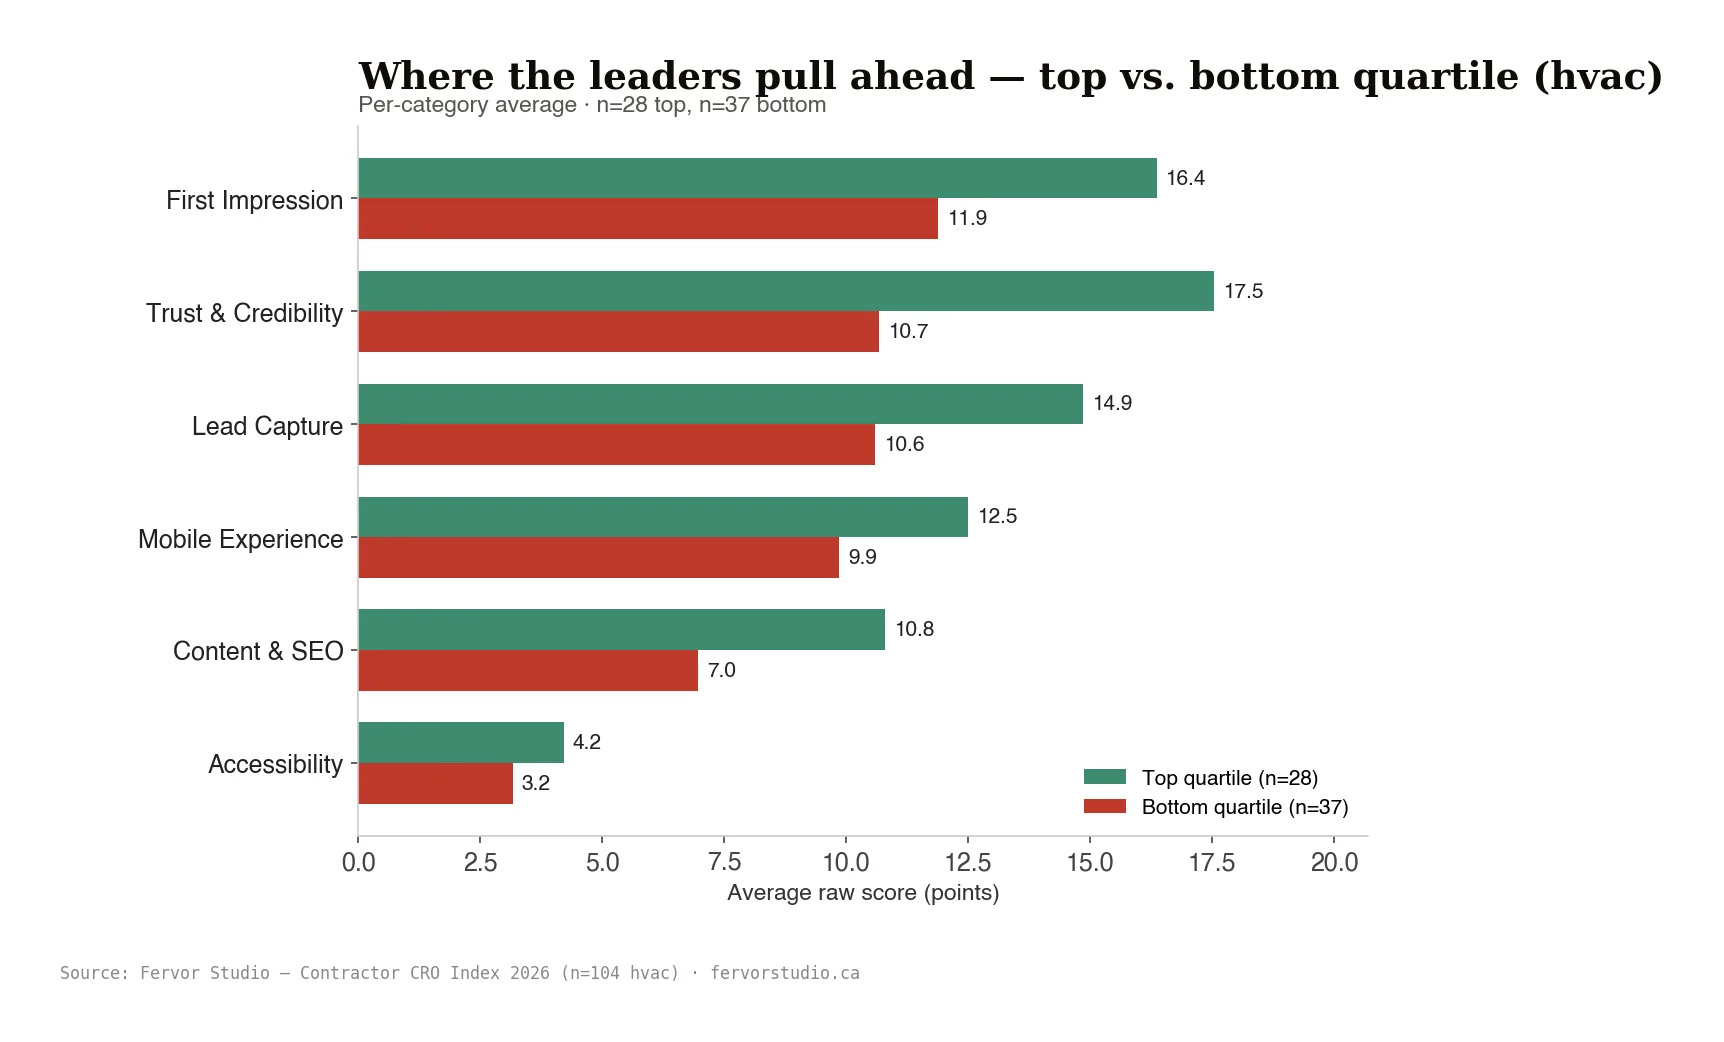
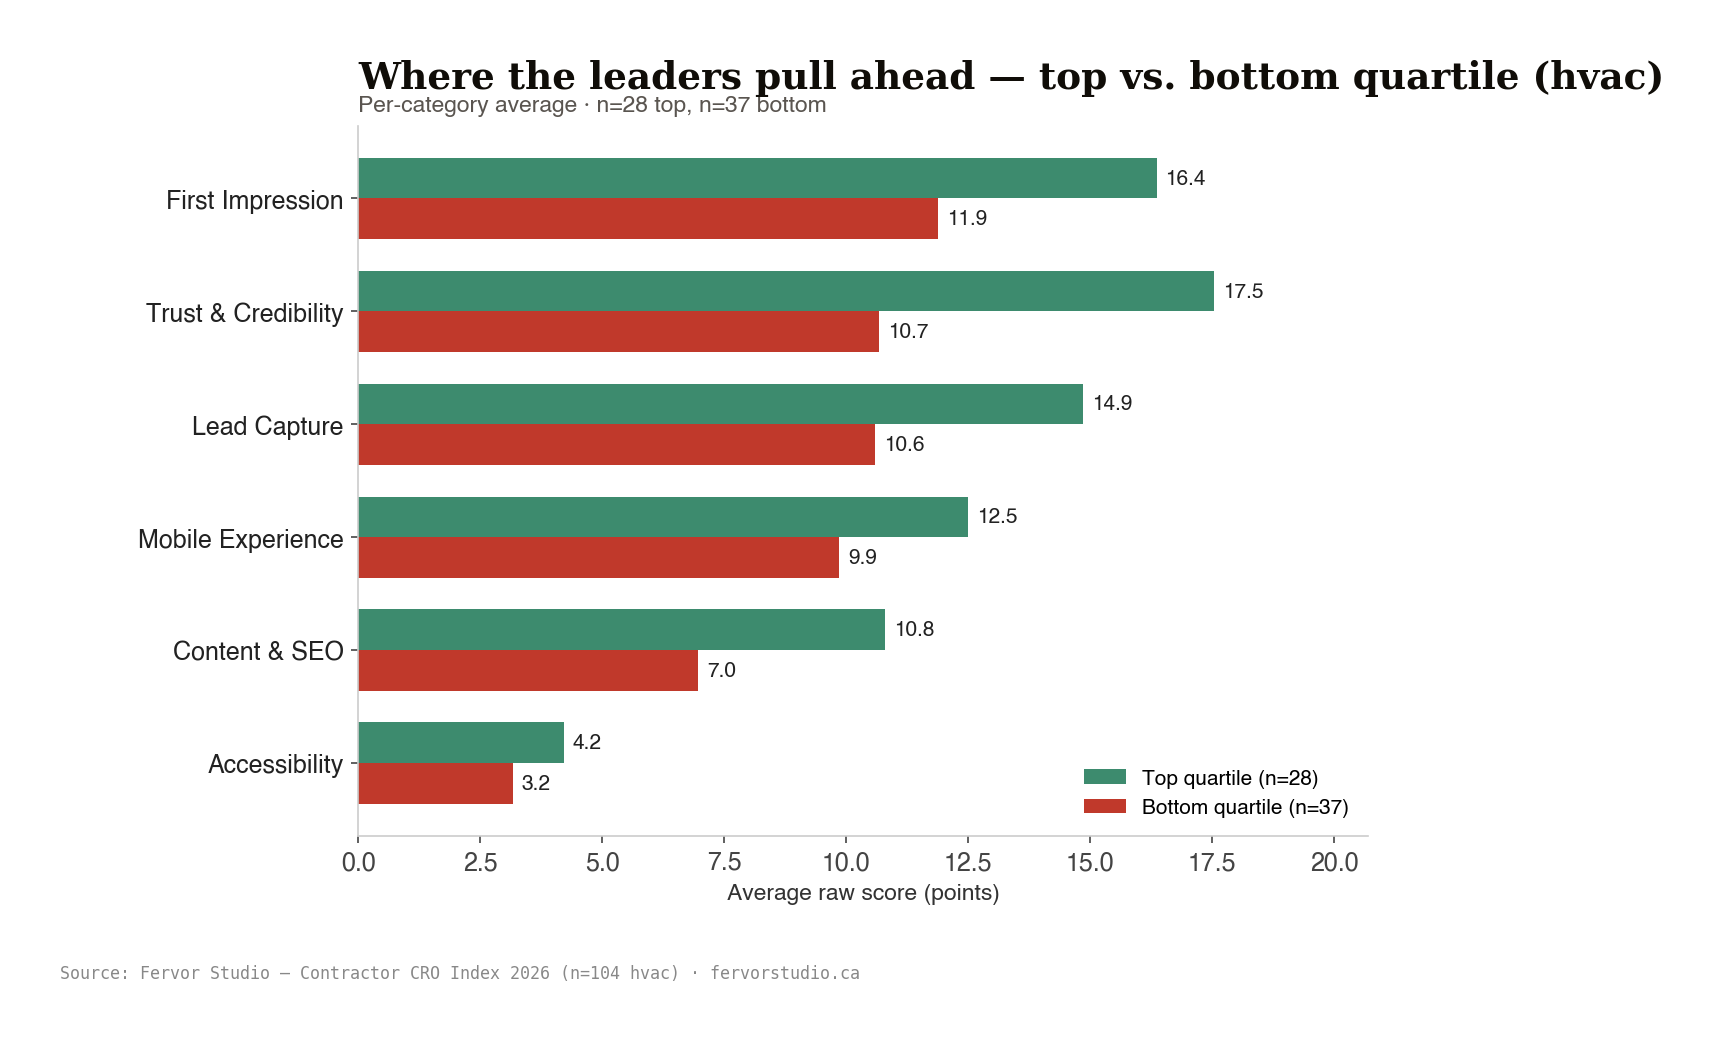
Mean category score for the top-28 HVAC brands compared to the bottom-37. Trust & Credibility and Content & SEO are where the gap is widest. Accessibility is the tightest gap: top and bottom brands both score badly on it, so it barely separates the trade at all.
The two groups aren't the same size. Quartile membership is set by score thresholds at the top and bottom of the distribution, not by forcing an equal headcount into each. HVAC scores cluster tightly (median 65, most brands within about 11 points of it), so ties at the cut lines fall unevenly: 28 brands land in the top group and 37 in the bottom.
02 / The full numbers
Every metric. Every trade-sample split. Every WCAG severity tier.
The receipts. From here down, the page renders every measurement Fervor Studio captured against the 104 HVAC brands in the 2026 trade sample. Each number traces to a screenshot, a DOM read, an axe-core 4.10.2 evaluation, or a Google Lighthouse 13.3.0 measurement.
We took 104 HVAC contractor websites and graded each one out of 100. Same six categories for every brand, letter grade A through F, in a window of 2026-05-19 to 2026-05-22. Every number on this page came from measuring something. Screenshots of each page on a phone and a desktop, a read of the underlying page, an accessibility check with axe-core (the open-source tool the WCAG community trusts), and Google's own performance tool, Lighthouse. So if a number on this page surprises you, we kept the receipts for every brand. You can ask for them.
Executive summary
Across the 104 HVAC sites we scored, the average Fervor Score came in at 65.32. Median 65. Standard deviation 11.02. The lowest was 31, the highest 90. On the same scale your kids get report cards on, 12 brands (12%) earned a B or better. And 63 (61%) earned a D or worse. The geography breakdown: 78 brands in the US (or with a non-Canadian web address) and 26 in Canada. Those numbers are the whole story. Everything below just explains them.
Summary statistics
Where the trade sits across the full score range. Quartile and decile cuts on the same 104-site sample as the rest of this page.
| Statistic | Value | Statistic | Value |
|---|---|---|---|
| Sites inspected (n) | 104 | Minimum Fervor Score | 31 |
| Mean | 65.32 | Maximum Fervor Score | 90 |
| Median | 65 | Q1 (25th percentile) | 60 |
| Standard deviation | 11.02 | Q3 (75th percentile) | 73 |
| 10th percentile (D1) | 52 | 90th percentile (D9) | 80 |
Fervor Grade distribution

Category performance
The 100 points break across six categories. Each row below shows the average score against the most a brand could earn in that category, plus how many brands hit a perfect score there (n at max) and how many took a zero (n at zero). The six categories don't add to a clean 100 because some carry more weight than others. Trust & Credibility is worth 22 points. Accessibility is worth 8. We weighted them that way on purpose. A trust gap costs a brand more work than a missing alt tag does.
The trade does best on Mobile Experience, at 73% of what's possible. It does worst on Accessibility, at 44%. The gap between those two is where the easy lift is hiding. So if you're looking at your own grade, that's the category to fix first.
Performance: Google Core Web Vitals
These numbers come from Google's own performance tool, Lighthouse 13.3.0. We ran one browser at a time, in order, so anyone can rerun and get the same answer. Google's thresholds for a mobile page: load the biggest visible piece in 2.5 seconds or less and it's “good.” Over 4 seconds is “poor.” Hold the page layout steady (under 0.1 shift) and it's “good.” Over 0.25 is “poor.” And this matters for two reasons. Buyers leave slow pages, and Google quietly drops them in rankings:
"Page experience signals, including Core Web Vitals, are part of how Google Search ranks pages. Sites that meet Core Web Vitals thresholds have a better user experience and can perform better in Search."
Understanding page experience in Google Search results, Google Search Central (2024)
So when the median HVAC site's biggest visible element takes longer than four seconds to load on a phone, that's hurting both rankings and conversions at the same time. Google drops it down the page, and buyers bail before the form even renders.
| Metric | Mobile mean | Mobile median | Desktop mean | Desktop median |
|---|---|---|---|---|
| Lighthouse performance score | 48.16 | 46 | 75.54 | 79.5 |
| LCP (s) Google "poor" > 4s | 8.35 | 6.24 | 2.27 | 1.71 |
| CLS Google "poor" > 0.25 | 0.08 | 0.01 | 0.08 | 0.01 |
| TBT (ms) | 3097.28 | 1469.5 | 272.83 | 81 |
| FCP (s) | 3.45 | 3.06 | 1.08 | 0.99 |
| Speed Index (s) | 6.1 | 5.58 | 2.07 | 1.75 |
Accessibility
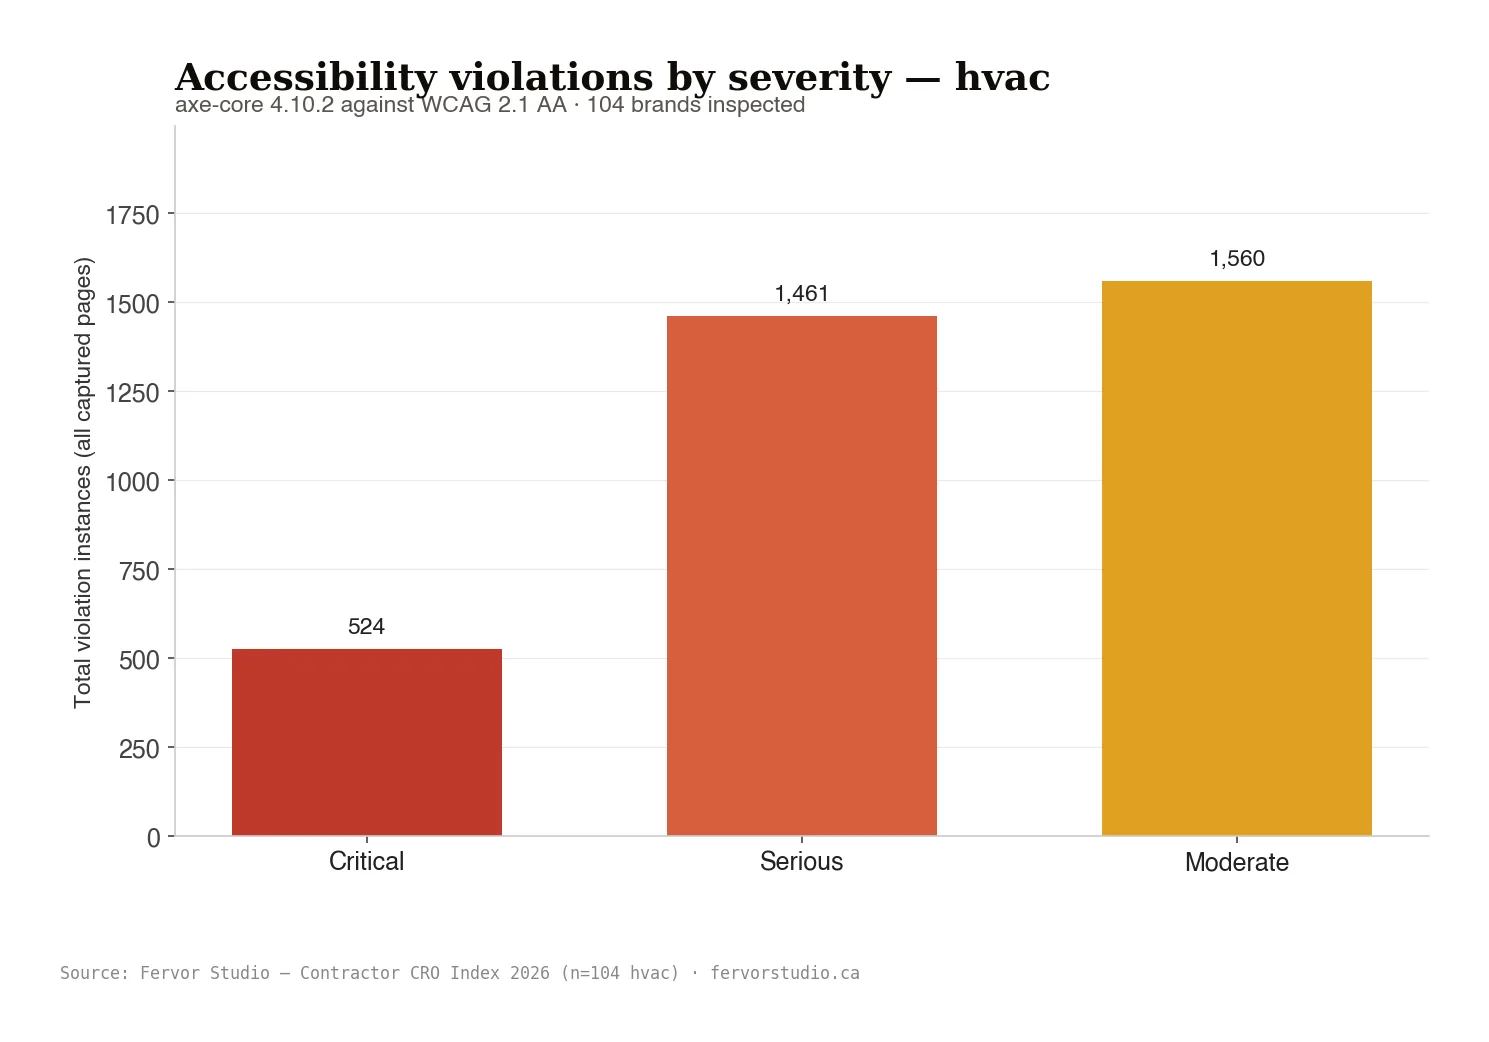
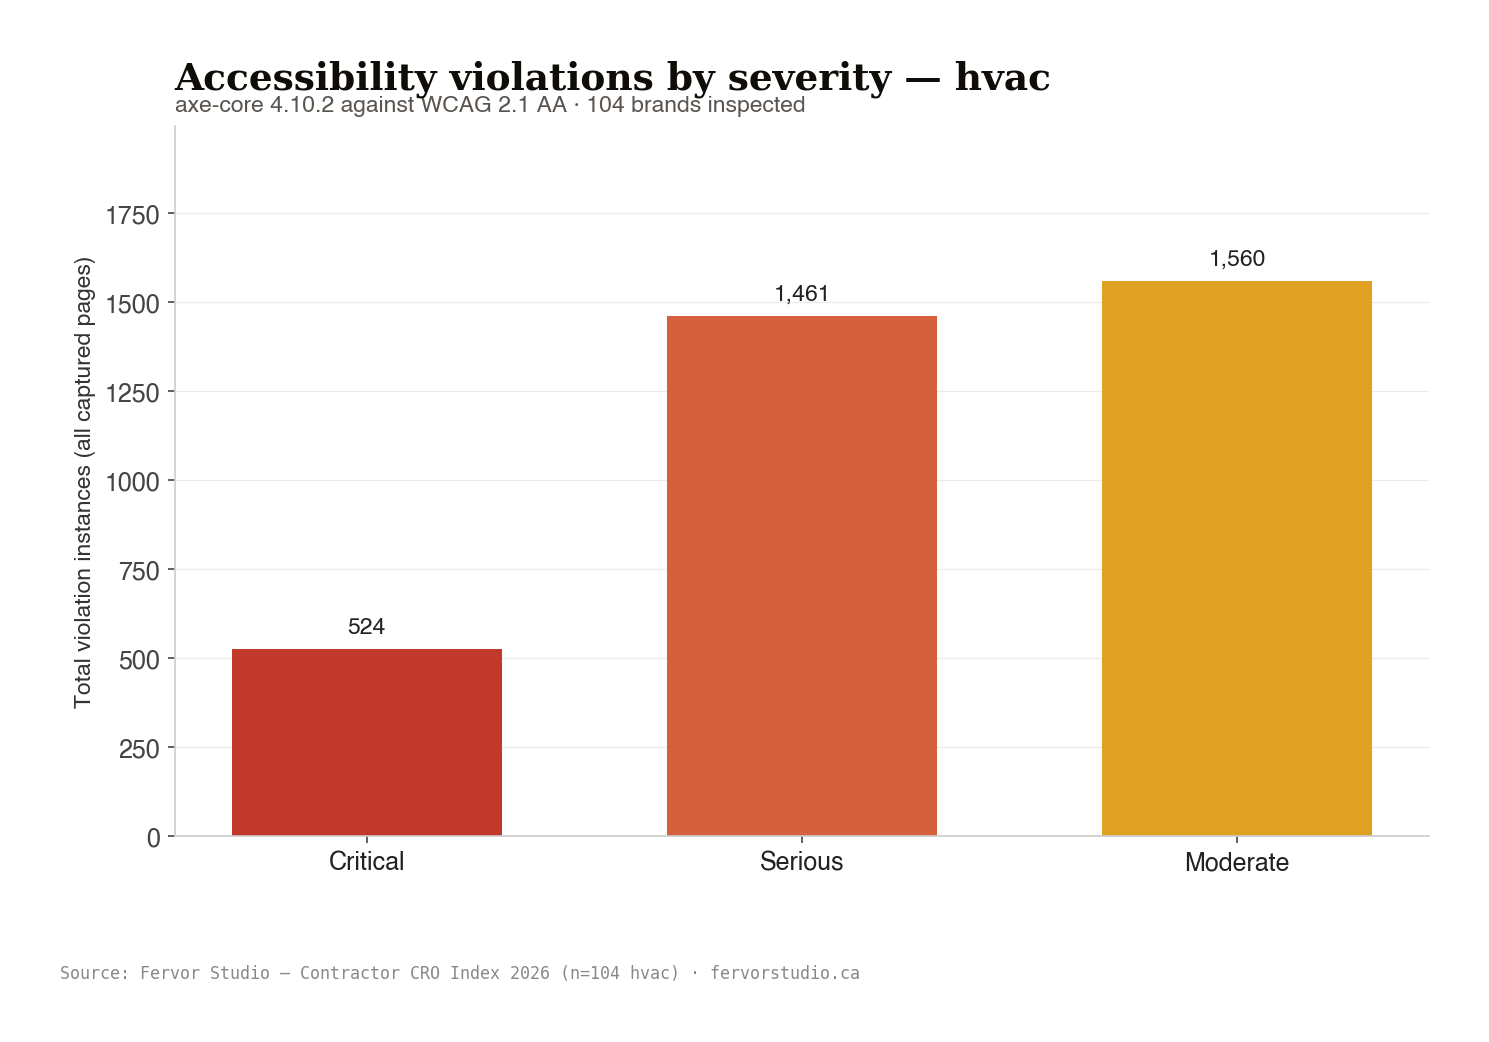
We ran axe-core 4.10.2 (the open-source accessibility checker the WCAG community trusts) against every brand's homepage, plus four other pages on each site, on both mobile and desktop. We counted every violation instance across those pages, and the per-brand rates below are the share of brands with at least one. We measured against WCAG 2.1 AA, the same standard the U.S. Department of Justice points to when applying the ADA to commercial websites.
Why overlay widgets don't earn credit
The accessibility overlay tools (AccessiBe, UserWay, AudioEye, EqualWeb, Recite Me, all of them) don't earn a brand any Fervor Grade™ credit, even when installed. Why. An overlay sits on top of a broken page instead of fixing what's underneath. That doesn't stop ADA Title III lawsuits, and courts and federal regulators have said so directly:
"The Ninth Circuit held that Title III of the ADA applies to a business's website and mobile app when those have a nexus to a physical place of public accommodation. In October 2019 the Supreme Court declined review, leaving the Ninth Circuit decision intact and exposing brick-and-mortar businesses nationwide to website-accessibility lawsuits."
Robles v. Domino's Pizza LLC, 913 F.3d 898 (9th Cir.) (2019)
"A blind plaintiff sued Eyebobs over website inaccessibility despite the site running an accessiBe overlay. The case settled by consent decree requiring the U.S. portion of the website be made accessible within 24 months, plus an accessibility coordination team, a published accessibility policy, regular reviews, training, and retention of an accessibility consultant."
Murphy v. Eyebobs LLC, W.D. Pa. (2021)
"The FTC's final order requires accessiBe to pay $1 million and bars the company from representing that its automated product can make any website WCAG-compliant or can ensure continued WCAG compliance over time, unless it has evidence to support such claims."
FTC Approves Final Order Requiring accessiBe to pay $1 Million, Federal Trade Commission (2025)
So we scored each page the way a visitor actually lands on it. Or the way a plaintiff's attorney does. No overlay credit. No “this would work if a screen reader user knew to click the floating widget.”
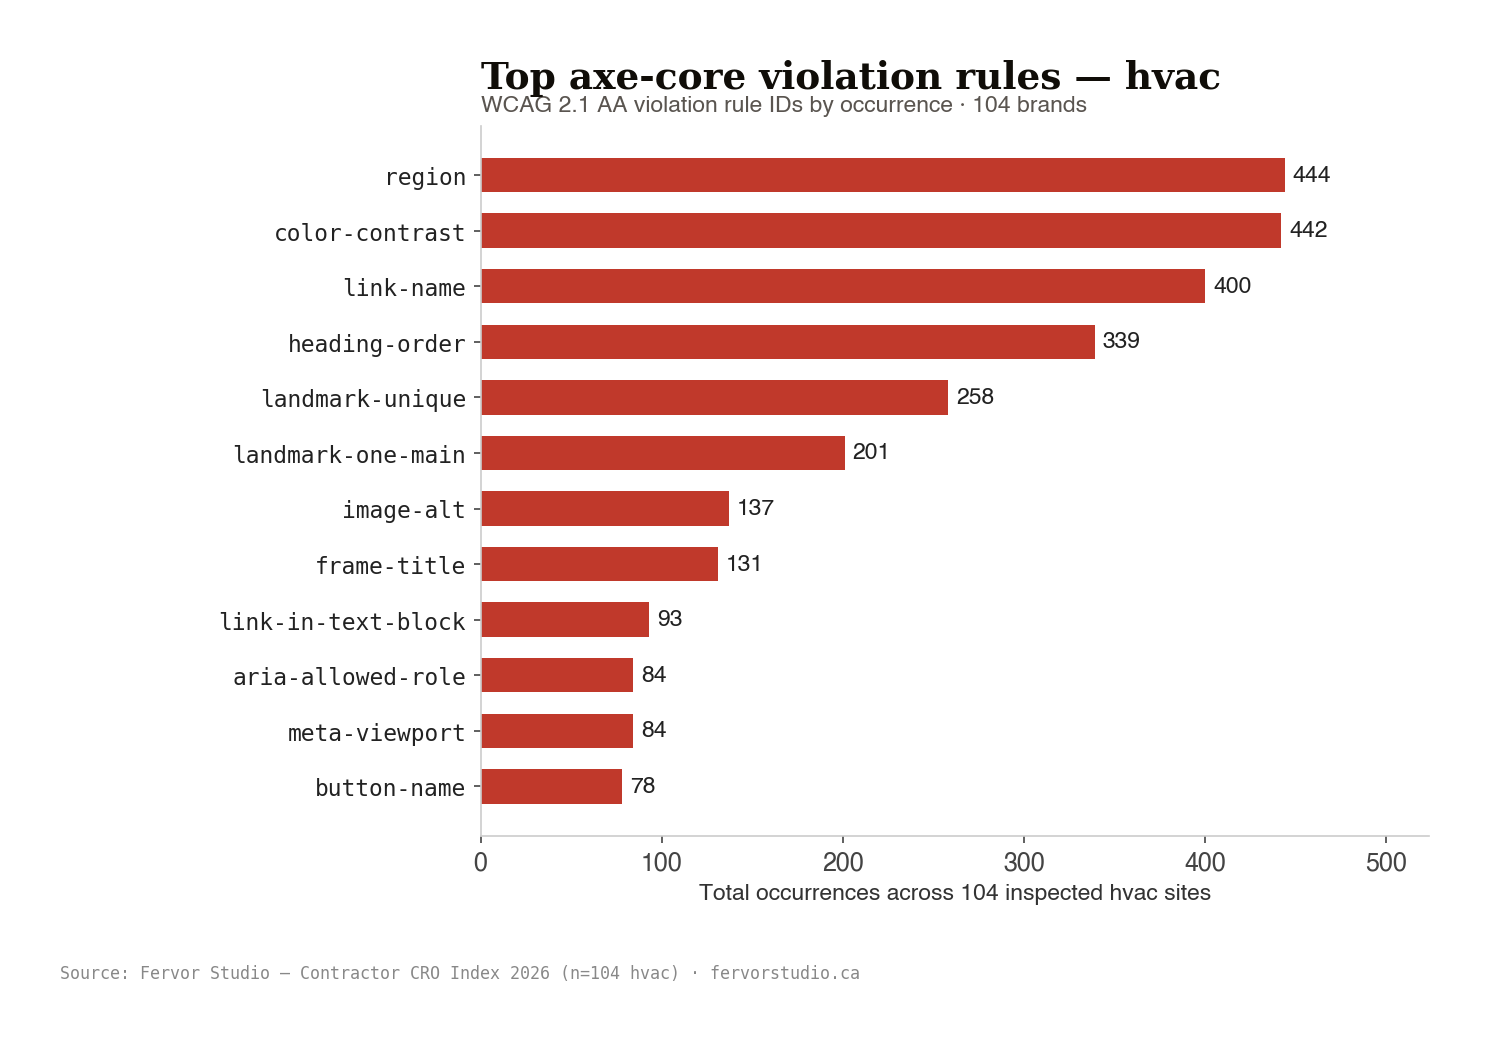
Most-frequent axe-core violations across the inspected sites
| axe-core rule | Times we caught it across the trade |
|---|---|
region | 444 |
color-contrast | 442 |
link-name | 400 |
heading-order | 339 |
landmark-unique | 258 |
landmark-one-main | 201 |
image-alt | 137 |
frame-title | 131 |
link-in-text-block | 93 |
aria-allowed-role | 84 |
meta-viewport | 84 |
button-name | 78 |

Why the accessibility numbers matter legally
The accessibility findings above translate directly into legal exposure under two frameworks. Most of the 104 HVAC brands in this sample would fail a compliance review under either.
ADA Title III · United States
The Americans with Disabilities Act applies to public accommodations, and federal courts have repeatedly held that includes commercial websites with a nexus to a brick-and-mortar place of business. The Ninth Circuit's ruling in Robles v. Domino's Pizza (2019), which the U.S. Supreme Court declined to review, is the controlling precedent. The Department of Justice's March 2022 guidance reinforced that public-accommodation websites must be accessible regardless of whether an overlay widget is installed. Critical and serious axe-core violations under WCAG 2.1 AA are exactly the line items that surface in demand letters: missing form labels, low colour contrast, image-alt failures, broken landmark regions. A 64.4% rate of brands shipping at least one critical violation isn't a theoretical defect. It's what plaintiffs' counsel screenshot.
AODA · Ontario, Canada
Canadian brands carry an additional layer. The Accessibility for Ontarians with Disabilities Act requires designated organizations to meet WCAG 2.0 Level AA on public-facing websites. Compliance reporting is mandatory under Ontario Regulation 191/11. Administrative monetary penalties reach $50,000 per day for an individual and $100,000 per day for a corporation, and they accumulate while a violation goes unresolved. The 26 Canadian HVAC brands in this sample sit inside AODA jurisdiction in addition to whatever cross-border ADA exposure they carry from U.S. visitors.
The overlay trap
Third-party accessibility overlay widgets (AccessiBe, UserWay, EqualWeb, AudioEye, Recite Me, and similar) bolt a settings panel on top of an existing site to expose limited accessibility controls. They do not repair the underlying source code. The WebAIM Overlay Fact Sheet, signed by hundreds of accessibility professionals and developers, documents the consensus position: overlays do not satisfy ADA, AODA, or WCAG. Courts have not treated overlay installation as a defense in digital-accessibility cases. Multiple lawsuits have proceeded against overlay-equipped sites.
"A blind plaintiff sued Eyebobs over website inaccessibility despite the site running an accessiBe overlay. The case settled by consent decree requiring the U.S. portion of the website be made accessible within 24 months, plus an accessibility coordination team, a published accessibility policy, regular reviews, training, and retention of an accessibility consultant."
Murphy v. Eyebobs LLC, W.D. Pa. (2021)
"The FTC's final order requires accessiBe to pay $1 million and bars the company from representing that its automated product can make any website WCAG-compliant or can ensure continued WCAG compliance over time, unless it has evidence to support such claims."
FTC Approves Final Order Requiring accessiBe to pay $1 Million, Federal Trade Commission (2025)
So a contractor reading “98%+ ADA compliant” inside an overlay vendor's dashboard is reading marketing copy, not a legal assessment. axe-core measures the rendered DOM at page load, what an assistive-technology user actually encounters. That's the number that matters when a demand letter arrives.
Conversion potential adoption
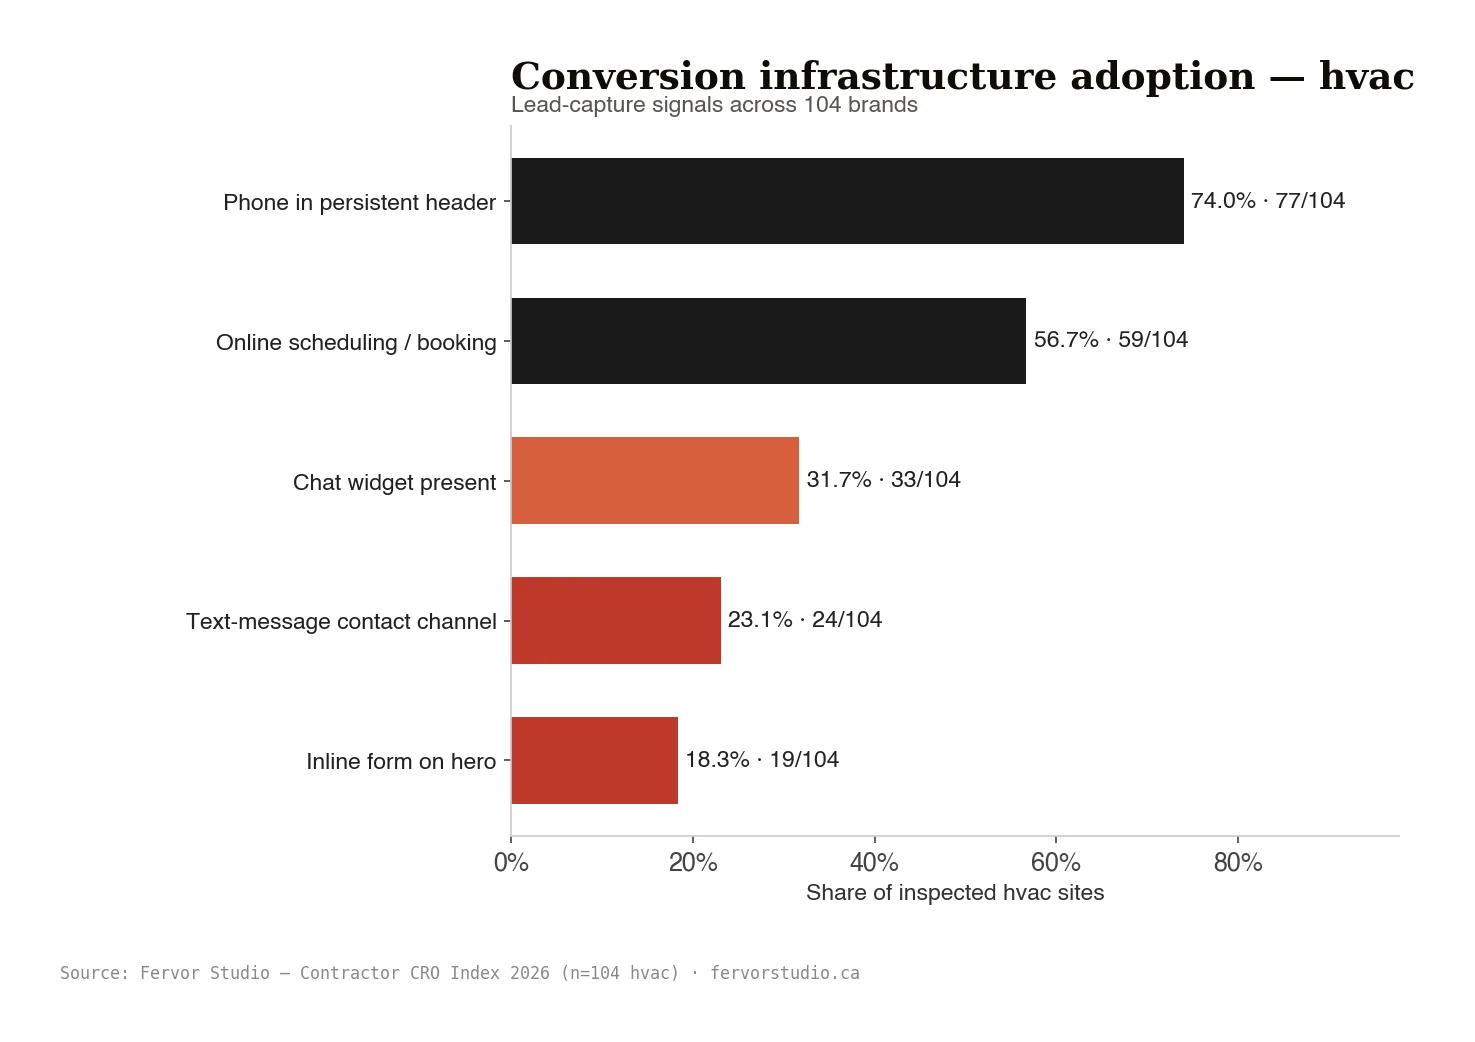
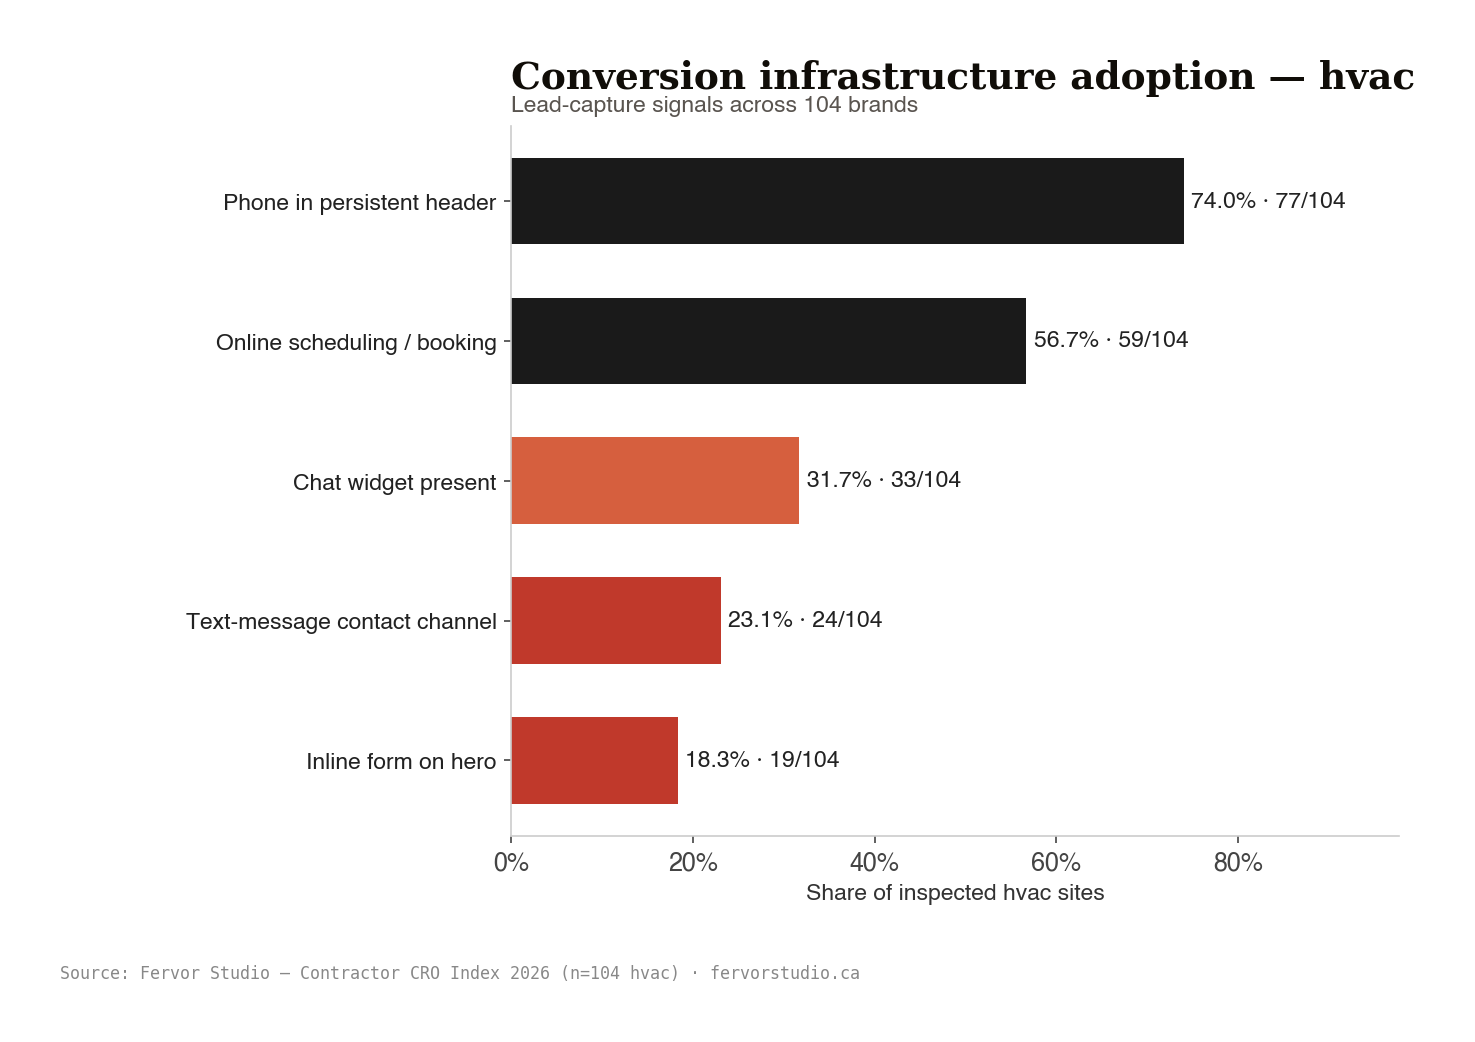
Five things every contractor site needs in order to turn a visitor into a phone call or a form submission. “Phone in persistent header” means a clickable phone number in the top section of the page, where buyers actually reach for it. A phone number buried in the footer doesn't count here, and it shouldn't. “Inline form on hero” means a form in the first thing visitors see, not below the fold. “Chat widget” here catches both the visible chat box and the named tools we look for, like Intercom, Drift, Tawk, and HubSpot. (That's the broad read. The intake section further down reports the stricter DOM-signature-only count, which runs lower.) “Online scheduling” means a real booking tool (Calendly, Acuity, Square Appointments), plus any “book online” copy that backs it up. And every percentage in this section is out of the same 104 brands we inspected.
| Conversion signal | Brands with it | Share of trade | |
|---|---|---|---|
| Phone in persistent header | 77 / 104 | 74% | |
| Online scheduling / booking | 59 / 104 | 56.7% | |
| Chat widget present | 33 / 104 | 31.7% | |
| Text-message contact channel | 24 / 104 | 23.1% | |
| Inline form on hero | 19 / 104 | 18.3% |
How visitors actually reach the trade
Every brand was scanned for the four ways a visitor can hand off to a contractor: phone (tel: links on the page), web form, embedded chat widget, and a click-through CTA.
The numbers below come from DOM extraction across each captured page, not self-reporting.
tel:) links per site (median; mean 5.85, max 198)
Phone is still the dominant intake mode for home-service trades. A single-location brand with one tel: link buried below the mobile header is leaking calls that would otherwise close.
Forms are the inverse story, the heaviest brand in this HVAC sample ships 46 forms across one site, most of them duplicate intakes embedded across location pages, service pages, and footers.
Each duplicate is another CRM-mapping liability.
Trust signals: the strategic five
Five trust signals that actually move buyers. We made a point of catching every way they can show up on a page. Take “Google reviews surfaced.” A brand qualifies if their site links to their Google Maps profile, if the page carries a structured review block Google can read, if they run a review widget (NiceJob, BirdEye, Podium), or even if they just write “4.9 stars on Google” somewhere in the copy. Same idea for license numbers. We catch “fully licensed,” state-specific contractor license prefixes (Oregon's CCB, Washington's WACL), and bare license numbers in body copy. The deeper trust signals (manufacturer credentials, financing partners, warranty language, BBB) live further down this page. Keeping them separate so the front-and-center signals don't get diluted by the structural ones.
| Trust signal | Brands with it | Share of trade | |
|---|---|---|---|
| Google reviews surfaced | 80 / 104 | 76.9% | |
| Team / craftsman photography | 75 / 104 | 72.1% | |
| License number on site | 35 / 104 | 33.7% | |
| Before/after photo gallery | 14 / 104 | 13.5% | |
| Trustpilot rating | 0 / 104 | 0% |
Positioning & service-mention coverage
Mentions on a website, not specialty. An HVAC brand that lists a given service as one of ten counts here, same as a brand that's built its entire identity around that service. The labels say “mentioned” for a reason. You're seeing what the trade talks about on its websites, not what any single brand uniquely owns. So if you want to know who genuinely specializes in a topic, that's a click-through into each site. This section is a coverage map, not a specialization map.
| Topic mentioned | Brands mentioning it | Share of trade | |
|---|---|---|---|
| Air conditioning service mentioned | 88 / 104 | 84.6% | |
| Emergency 24/7 service messaging | 81 / 104 | 77.9% | |
| Financing offered | 73 / 104 | 70.2% | |
| Furnace service mentioned | 72 / 104 | 69.2% | |
| Indoor air quality mentioned | 70 / 104 | 67.3% | |
| Tune-up / maintenance plan mentioned | 70 / 104 | 67.3% | |
| Heat pump service mentioned | 66 / 104 | 63.5% | |
| Ductless / mini-split service mentioned | 63 / 104 | 60.6% | |
| Commercial HVAC service mentioned | 33 / 104 | 31.7% | |
| Energy rebates / incentives mentioned | 33 / 104 | 31.7% | |
| Smart thermostat mentioned | 29 / 104 | 27.9% | |
| Geothermal service mentioned | 15 / 104 | 14.4% | |
| Refrigerant changeover messaging | 2 / 104 | 1.9% | |
| Multi-state coverage messaging | 0 / 104 | 0% | |
| National franchise messaging | 0 / 104 | 0% |
Manufacturer credentials in the wild
What's actually visible on the page. We read each brand's site and only credit a manufacturer credential if it shows up where a buyer can see it. A footer badge, “certified installer” copy, a link out to the manufacturer's brand page. We don't credit credentials buried in a PDF or claimed in a sales call. So if a brand is GAF Master Elite but their site never says so anywhere a buyer would find it, they don't show up here. And that's the right call. A credential nobody can see isn't earning trust.
| Credential or partner | Brands showing it | Share of trade | |
|---|---|---|---|
| Better Business Bureau | 6 | 5.8% | |
| BBB Accredited | 3 | 2.9% | |
| Atlas | 2 | 1.9% | |
| A+ BBB | 1 | 1% |
What search engines see on the page
98% of HVAC brands publish a page title. That's the floor. Google reads it as the headline of the search result, the first thing a buyer sees before they click. The typical page title runs 61 characters, and 53% of brands blow past Google's 60-character truncation point. So the title shows up clipped on phones, the surface most HVAC buyers are searching from.
Meta descriptions are messier. 15% of brands publish no meta description at all, leaving Google to scrape one from the page (rarely the sentence you'd have chosen yourself). When one does exist, the typical meta description runs 146 characters. And 88.5% of HVAC brands publish structured-data markup. That number is adoption only. Most stop at Organization or LocalBusiness, missing the nested Service, Review, AggregateRating, and FAQPage entities Google needs before any of the rich-result formats can render.
Most common structured-data types used
| Schema type | Brands publishing it | Share of trade |
|---|---|---|
HVACBusiness | 22 | 21.2% |
Organization | 17 | 16.3% |
LocalBusiness | 16 | 15.4% |
WebSite | 16 | 15.4% |
FAQPage | 13 | 12.5% |
Product | 13 | 12.5% |
Service | 7 | 6.7% |
BreadcrumbList | 6 | 5.8% |
Plumber | 5 | 4.8% |
WebPage | 5 | 4.8% |
Form complexity
Field counts collapse Gravity Forms composite inputs (one logical "Name" field = one count, not two sub-inputs) and exclude framework hidden inputs (Gravity Forms gform_*, WPForms wpforms[recaptcha], Contact Form 7 _wpcf7*, reCAPTCHA tokens, honeypots). Counted via scripts/lib/visible_form_fields.py.
How the trade structures its pages
H1 is the single most weight-carrying heading element on a page. Best practice is one descriptive H1 per page, with a clean H2 / H3 hierarchy underneath.
The HVAC trade doesn't follow that practice. 14.4% of HVAC brands ship homepages with multiple H1 elements, usually because the page builder marks every section heading as an H1.
And 7% ship pages with no H1 at all, typically because a visual hero replaces it with display text styled to look like a heading but rendered as a div.
| Heading-hierarchy metric | Value |
|---|---|
Brands with at least one H1 across captured pages | 93% |
Brands with zero H1 across captured pages (broken signal) | 7% |
Brands with multiple H1 elements on the homepage (best-practice violation) | 14.4% |
Brands with proper H1 → H2 → H3 hierarchy | 61% |
Typical H1 count per captured page (median) | 2 |
Mean H1 count per captured page | 2.62 |
Heaviest site: H1 elements on a single page | 24 |
Mean first-H1 length (characters) | 51.97 |
Heading hierarchy is a shared SEO and accessibility signal. The heading-order defect on this page also surfaces on the accessibility section (axe-core's heading-order rule is one of the most-frequent violations).
Fixing the H1 problem cleans up two scorecard categories at once.
The cheapest unfair advantage in the trade
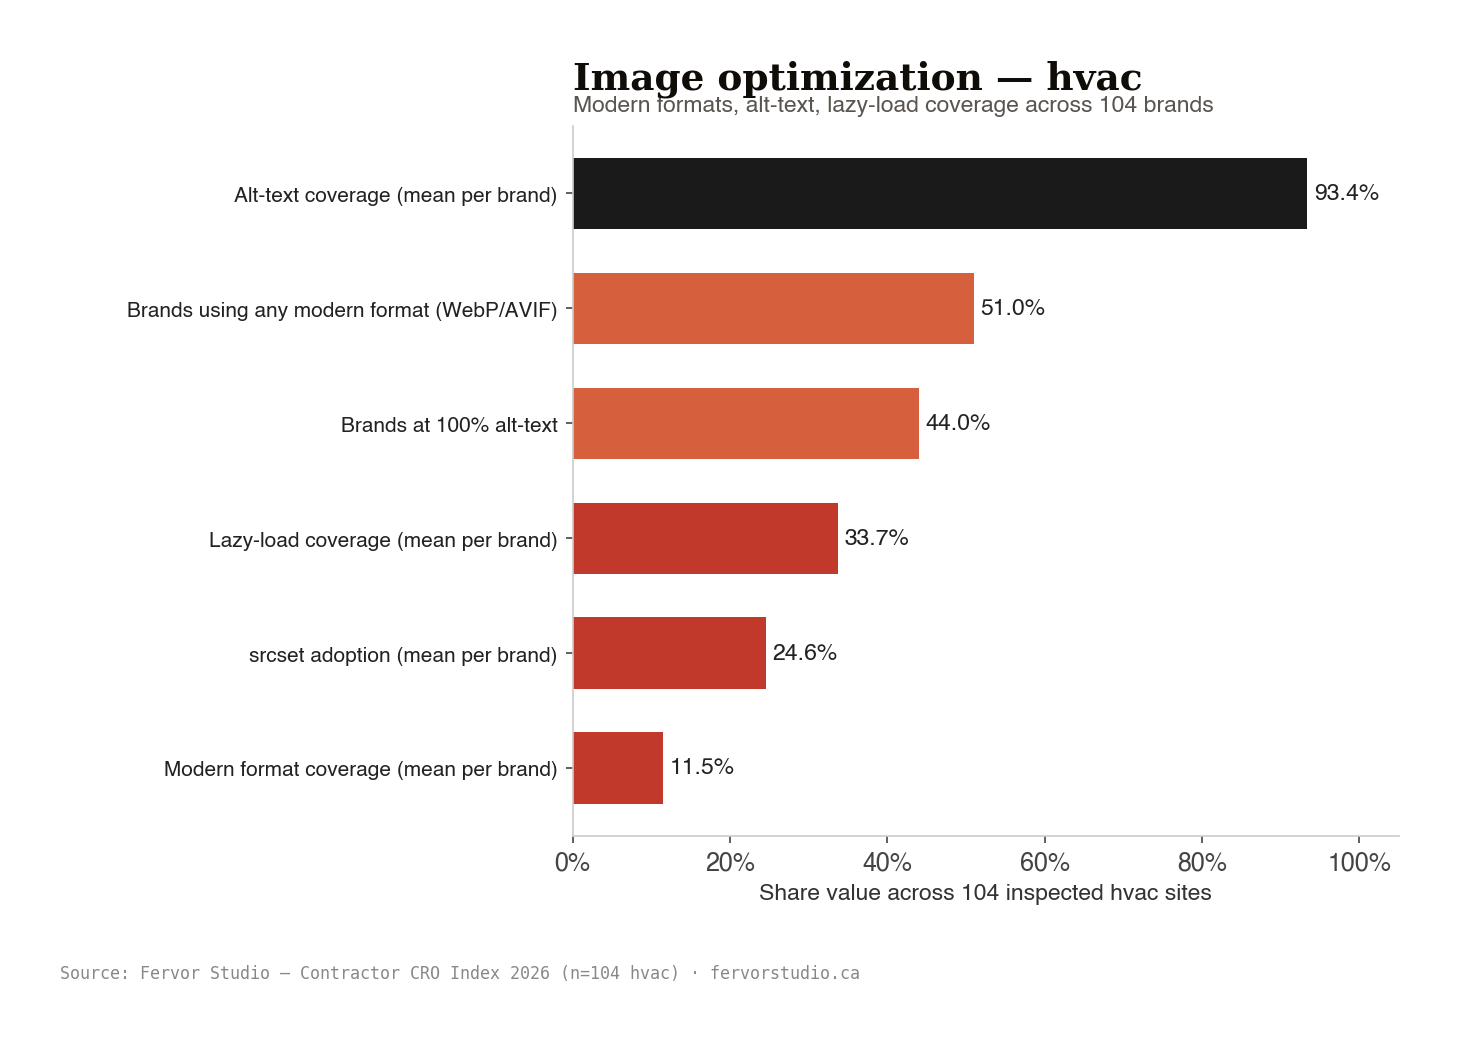
The median HVAC brand ships 183 images across their captured pages. The mean is 279.
The heaviest brand ships 3320 images on a single site, most of them un-optimized.
Image weight is the dominant contributor to mobile LCP in this trade, and the fix is mechanical: convert to WebP, enable lazy-load, ship srcset.
None of those require a redesign. All three are afternoon-of-developer-time fixes. And none of them are happening at scale.
The mean image count per brand is 279, and lazy-load coverage averages 33.7% across those images. So a typical brand ships roughly 185 images that load eagerly on every page request, most of which the visitor never scrolls to. Modern-format adoption at 11.5% means the same hero photo a contractor ships as a 2MB JPEG could be a 200KB WebP without any visible quality difference. The alt-text picture is the bright spot: mean coverage runs 93.4%, and 44% of brands ship 100% coverage.

AI integration adoption
Two buckets, kept separate so the numbers stay honest. Confirmed AI means the site is talking to a real AI service in the background (OpenAI, Anthropic, or Google Gemini), or running an AI-first chatbot like Ada, Chatfuel, ManyChat, Landbot, Botpress, or Kommunicate. Or the page just says “AI-powered” or “powered by GPT” in plain English. Chat platforms with optional AI covers HubSpot Conversations, Intercom, Drift, Tidio, and Crisp. Those tools sell AI as a paid add-on, but a chat widget being installed doesn't prove the AI is switched on. So we count them in their own bucket. Otherwise every HubSpot install would inflate the AI number and this whole section would lose its meaning.
Confirmed AI integration: 1% of brands
| Vendor / signal | Brands | % |
|---|---|---|
| AI-marker copy on site | 1 | 1% |
Chat platforms with optional AI features: 2% of brands
| Vendor | Brands | % |
|---|---|---|
| Tidio (AI is opt-in) | 2 | 2% |
Marketing & analytics stack
We read every page on every brand's site and looked for the named tools they had running. Numbers below describe what's actually installed on the typical HVAC contractor's website. Not what an agency proposal claimed they were going to install.
What MarTech the trade has installed (89% of brands)
| Google Analytics / GTM | 87 | 87% |
| Microsoft Clarity | 21 | 21% |
| Hotjar | 11 | 11% |
| Adobe Analytics | 7 | 7% |
| HubSpot Marketing | 3 | 3% |
| VWO | 3 | 3% |
| Mailchimp | 2 | 2% |
| Optimizely | 1 | 1% |
| Crazy Egg | 1 | 1% |
Which ad-network pixels the trade fires (52% of brands)
| Facebook Pixel | 48 | 48% |
| Bing UET | 25 | 25% |
| Reddit Pixel | 5 | 5% |
| TikTok Pixel | 4 | 4% |
| Google Ads Conversion | 3 | 3% |
| LinkedIn Insight | 2 | 2% |
| Pinterest Tag | 2 | 2% |
| Twitter / X Pixel | 1 | 1% |
CRM and lead-capture vendors (37% of brands)
| ServiceTitan | 32 | 32% |
| Podium | 4 | 4% |
| Jobber | 1 | 1% |
| Setmore | 1 | 1% |
| Housecall Pro | 1 | 1% |
| LiveChat | 1 | 1% |
Pop-ups and exit-intent (2% of brands)
| Exit-intent (vendor-agnostic) | 1 | 1% |
| OptinMonster | 1 | 1% |
Tech stack profile
Tech-stack detection runs on the rendered HTML we captured for every brand. Each percentage below is out of all 104 HVAC sites in the sample.
CMS platform
| WordPress | 63 | 63% |
| Duda | 3 | 3% |
| Drupal | 1 | 1% |
| Squarespace | 1 | 1% |
| Wix | 1 | 1% |
Page builders
| Gutenberg Blocks | 58 | 58% |
| Elementor | 37 | 37% |
| Divi | 23 | 23% |
| Oxygen Builder | 5 | 5% |
| WPBakery | 4 | 4% |
| Thrive Architect | 2 | 2% |
JS frameworks
| jQuery | 65 | 65% |
| Bootstrap CSS | 14 | 14% |
| Foundation | 6 | 6% |
| Tailwind CSS | 4 | 4% |
| Alpine.js | 3 | 3% |
| Vue.js | 2 | 2% |
| Next.js | 2 | 2% |
| React | 1 | 1% |
Hosting / CDN
| Google CDN (gstatic) | 65 | 65% |
| Cloudflare | 26 | 26% |
| jsDelivr | 12 | 12% |
| AWS CloudFront | 11 | 11% |
| unpkg | 6 | 6% |
| Vercel | 2 | 2% |
Trust badges and credentials the trade actually shows
One unified read across each whole site. Financing partners by name, warranty language, certification tiers, ownership claims. We anchored every pattern specifically so we wouldn't catch false positives. For example, "Best of Houzz 2025" or "Best of Angi 2024" qualifies. A loose "best of" floating in a paragraph doesn't.
| Trust signal | Brands showing it | Share of trade |
|---|---|---|
| 24/7 service | 67 | 67% |
| Generic financing offered | 50 | 50% |
| Emergency service | 47 | 47% |
| Free estimate / quote | 45 | 45% |
| Years-in-business claim | 44 | 44% |
| Insurance / bonded | 41 | 41% |
| Award. Best of / Top rated | 32 | 32% |
| Same-day service | 27 | 27% |
| Family-owned | 27 | 27% |
| 100% satisfaction | 26 | 26% |
| Better Business Bureau A+ | 14 | 14% |
| ACCA membership | 11 | 11% |
| NATE certification | 8 | 8% |
| Manufacturer cert. Carrier | 7 | 7% |
| Angi / Angie's List | 6 | 6% |
| Lifetime warranty | 6 | 6% |
| Customer-count claim | 5 | 5% |
| Carrier Factory Authorized Dealer | 5 | 5% |
Content patterns
What kind of content lives on the site, based on URL paths and how each page is laid out.
| Content pattern | Brands with it | Share of trade |
|---|---|---|
| Service area listing | 60 | 60% |
| Team / staff page | 58 | 58% |
| Blog or news section | 49 | 49% |
| Financing / Promo page | 39 | 39% |
| FAQ section | 37 | 37% |
| Careers / Hiring page | 32 | 32% |
| Customer testimonials | 25 | 25% |
| YouTube video embed | 21 | 21% |
| Native HTML5 video | 14 | 14% |
| Resource library | 11 | 11% |
What separates the top quartile from the bottom
The top-28 brands averaged against the bottom-37. The bigger the gap, the more that category separates winning sites from losing ones.
| Category | Top quartile | Bottom quartile | Gap (points) | Gap as share of category max |
|---|---|---|---|---|
| First Impression | 16.36 | 11.89 | +4.47 | 22.4% |
| Trust & Credibility | 17.54 | 10.68 | +6.86 | 31.2% |
| Lead Capture | 14.86 | 10.59 | +4.26 | 21.3% |
| Mobile Experience | 12.5 | 9.86 | +2.64 | 17.6% |
| Content & SEO | 10.79 | 6.97 | +3.81 | 25.4% |
| Accessibility | 4.21 | 3.16 | +1.05 | 13.1% |
How the trade structures its websites
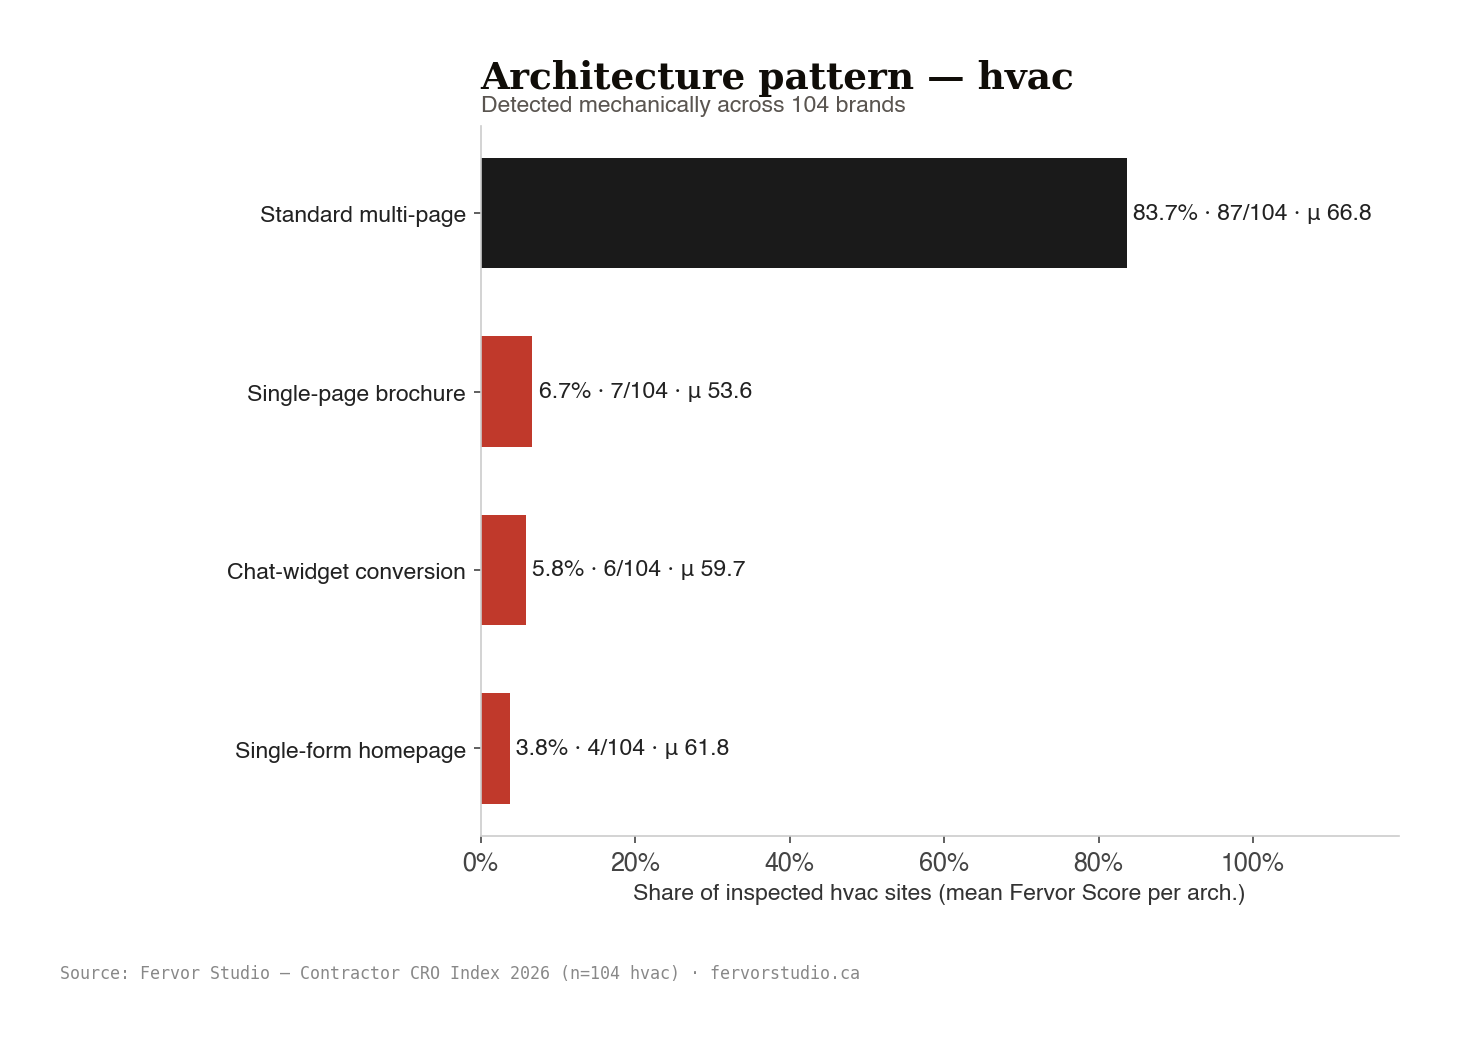
Architecture detected mechanically: URL discovery, page-role coverage, and HTML patterns. The bulk of the HVAC trade uses the canonical multi-page layout (homepage + service + location + contact). Single-page brochures score meaningfully lower because the framework rewards page-role coverage. Multi-step quiz capture and chat-widget conversion architectures appear in small numbers, often outscoring single-page sites because they handle intake more deliberately.
| Architecture pattern | Brands | Share of trade | Mean Fervor Score |
|---|---|---|---|
| Standard multi-page (homepage + service + location + contact) | 87 | 83.7% | 66.82 |
| Single-page brochure | 7 | 6.7% | 53.57 |
| Chat-widget-driven conversion | 6 | 5.8% | 59.67 |
| Single-form homepage | 4 | 3.8% | 61.75 |

Who they are, where they are
Tenure is derived from “since YYYY” / “established YYYY” patterns in body text on each captured site. A brand without such a phrase is excluded from the tenure aggregate, not “new,” just “didn't display founding year prominently.” 51 HVAC brands (49% of the trade sample) surface a founding-year marker on their public site, and the median one among them dates to the 1980s. The breakdown by founding decade is below.
| Founding decade | Brands | Mean Fervor Score |
|---|---|---|
| 1920s | 2 | 63.5 |
| 1940s | 2 | 68.5 |
| 1950s | 3 | 68.67 |
| 1960s | 1 | 56 |
| 1970s | 11 | 71.27 |
| 1980s | 9 | 68.22 |
| 1990s | 11 | 64.82 |
| 2000s | 8 | 68.5 |
| 2010s | 3 | 72.67 |
| 2020s | 1 | 71 |
Geographic split
| Region | Brands | Share of sample |
|---|---|---|
| United States / non-Canadian TLD | 78 | 75% |
| Canada | 26 | 25% |
| Total | 104 | 100% |
An addressable-opportunity projection
Read this carefully. The Revenue Loss Estimate is a modelled industry projection, not a measurement of any single brand's actual revenue loss. The formula uses uniform per-trade traffic benchmarks. Each brand's RLE assumes the same range of monthly visitors regardless of brand size, the same close rate, and the same average project value. This matches what comparable industry research bodies do (NRCA, IBISWorld, JCHS, Verified Market Reports) and exists for inter-brand comparability inside the trade sample, not for per-brand financial planning.
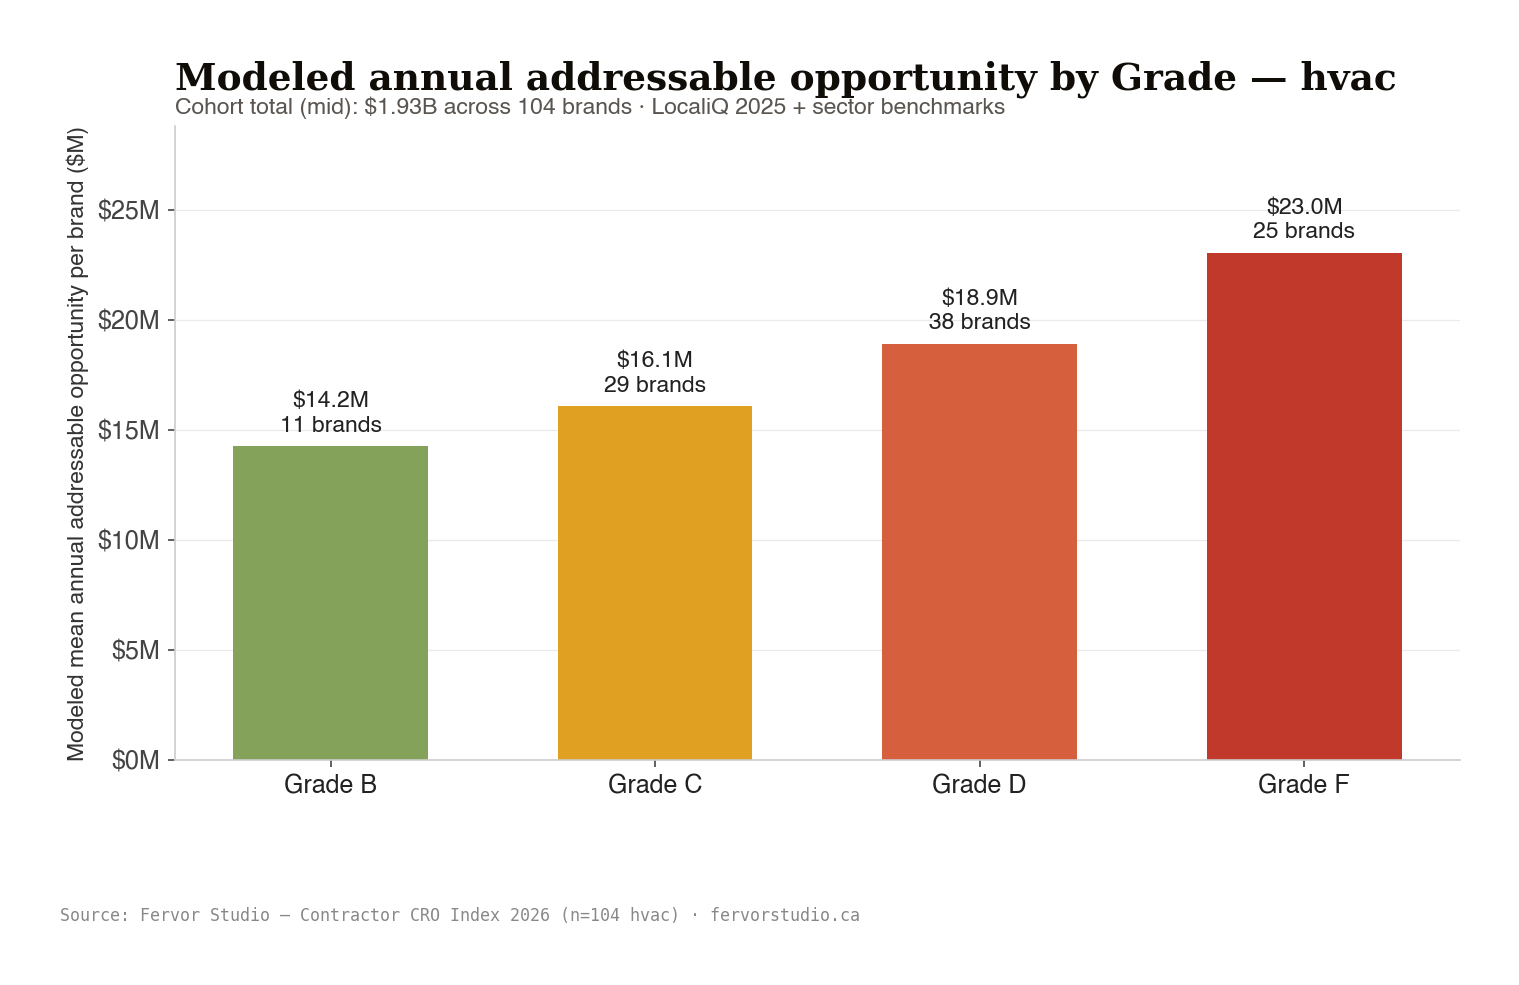
The right way to read this is as the category-level addressable conversion-uplift opportunity. So if every HVAC brand inspected received its benchmark monthly traffic and improved its on-site conversion rate by the amount its Fervor Score implies, this is the modelled total of new revenue the category would capture. The figure should not be summed against any single brand's books, and small local operators sit inside the same traffic assumption as national franchises.
Modeled annual figure by Fervor Grade
| Fervor Grade | Brands | Mean modeled annual |
|---|---|---|
| Grade A (Honor) | 1 | $12M |
| Grade B (Passing) | 11 | $14M |
| Grade C (Conditional) | 29 | $16M |
| Grade D (Probation) | 38 | $19M |
| Grade F (Condemned) | 25 | $23M |

Methodology disclosure
Revenue Loss Estimate is a MODELED INDUSTRY PROJECTION, not a measurement of any individual brand's actual revenue loss. The formula uses uniform per-trade traffic benchmarks (5,000-15,000 monthly visitors for all HVAC brands, regardless of brand size). Each brand's RLE = (benchmark CVR − benchmark CVR × Fervor Score / 100) × benchmark monthly visitors × 0.35 close rate × trade-benchmark avg project value × 12 months. This methodology matches industry-standard comparative analyses (NRCA, IBISWorld, JCHS, Verified Market Reports) for inter-brand comparability. PER-BRAND RLE IS NOT RELIABLE FOR COMPARING BRANDS OF DIFFERENT SCALE. national franchises and small local operators use identical traffic assumptions. Trade sample-aggregate RLE represents 'addressable conversion-uplift opportunity across the category assuming benchmark traffic,' not a sum of measured losses.
How we measured this
Same process on every HVAC brand. We captured full-page screenshots at desktop and mobile width across every page our crawler could reach. Then we read each underlying page. We looked at forms, the structured markup Google uses to build rich results, phone and email links, social-media links, manufacturer badges, review widgets, chat widgets, and common body-copy patterns. We ran axe-core 4.10.2 (open-source accessibility, configured against WCAG 2.1 AA). And we measured Core Web Vitals using Google Lighthouse 13.3.0. Then we scored what we captured against the Fervor Grade™ Framework. 100 points across six categories, and a letter grade A through F.
Base Score and Grade Adjustments
Every Fervor Score on this page is an Adjusted Score. That's the Base Score the framework returned, plus any Grade Adjustments. A Grade Adjustment is a small, documented correction we apply where the standard rubric penalty overstates the real conversion impact for the HVAC trade. Across the HVAC trade sample, the Base Score mean is 63.84 and the Adjusted Score mean is 65.32, a net Grade Adjustment of 1.48 points up. The headline figures on this page, including the 65.32 mean, are the Adjusted Scores.
What “header-prominent” means
A few of the signals on this page depend on where something sits on the page, not just whether it exists. “Phone in persistent header” means a clickable phone number in the top section of the page, the part that stays visible as a visitor scrolls. A phone number buried in the footer doesn't earn the credit. “Inline form on hero” means a form in the first thing a visitor sees when the page loads, before any scrolling happens.
What we count as a real tool
For the marketing-stack, accessibility, and AI sections, we only credit a named tool if its signature shows up in what the page actually loads. Intercom, Drift, Tawk, HubSpot, OpenAI, axe-core, Lighthouse, and so on. We don't take a brand's word for what's installed. And we don't ding a brand for things they choose not to advertise. So if we can't find the named tool in the page, it doesn't count.
The averages on this page (means, medians, distributions) are reproducible. Anyone with the same captures can compute the same number. Per-brand callouts aren't published here because they're still in the integrity-review queue. Individual scores live on each brand's published report under the Contractor CRO Index.
Citation
"HVAC Contractor Website Performance: State of the Industry 2026." The Contractor CRO Index, Fervor Studio. 2026-05-22. Sample size: 104. Methodology: Fervor Grade™ Framework.
Short form: (Contractor CRO Index, Fervor Studio, 2026) · Publisher: Fervor Studio · fervorstudio.ca
Glossary of terms
Definitions for terms used on this page. Where a term is also industry-standard (WCAG, axe-core, Lighthouse), the definition reflects how the Fervor Grade™ Framework applies it.
Fervor Grade™ Framework
A 100-point, 6-category framework for evaluating contractor websites on the dimensions that drive lead generation and conversion. Each Site Inspection produces a Fervor Score (numeric, 0 to 100) which maps to a Fervor Grade™ (letter, A to F) using standard school grading thresholds. Categories are weighted: First Impression (20pts), Trust & Credibility (22pts), Lead Capture (20pts), Mobile Experience (15pts), Content & SEO (15pts), Accessibility (8pts).
Site Inspection
An individual brand's Site Inspection. Combines screenshot review of every homepage / service / location / contact page across mobile and desktop viewports, structured DOM extraction (phone numbers, schema markup, form fields, credentials), WCAG 2.1 AA evaluation using axe-core, Core Web Vitals measurement via Google Lighthouse, and call-to-action click-through verification.
Grade Adjustment
A post-framework correction applied to a brand's Base Score when contextual factors warrant it. Example: a brand running a 24/7 emergency service gets a partial Grade Adjustment if their phone number is not visible above the fold (the standard framework penalty is heavier than the actual conversion impact for their trade). The Adjusted Score (final Fervor Score) equals Base Score plus the sum of Grade Adjustment deltas.
DOM Facts
Structured data extracted from a page's rendered DOM at capture time: schema.org JSON-LD markup, tel: and mailto: links, form field structures, social-media link patterns, manufacturer / certification badges in body text, review widget signatures, alt-text on images, and chat-widget presence. Provides a mechanical second source of truth alongside the visual screenshot.
Revenue Loss Estimate (RLE)
A modelled industry projection of annual revenue a contractor is estimated to leave on the table due to website conversion underperformance relative to a top-tier benchmark in the same trade. Computed using LocaliQ 2025 lead-to-customer benchmarks. RLE is a trade-comparability tool, not a per-brand balance-sheet figure. Per-brand RLE is unreliable for comparing brands of different scale because the formula uses uniform traffic assumptions across the trade.
Addressable Opportunity
The calculated financial lift available across a trade if every brand lifted its on-site conversion rate by the amount its Fervor Score implies. The trade-sample aggregate RLE expresses this addressable opportunity. Individual brands recover some fraction of their per-brand modeled figure depending on actual traffic, ticket size, and operational execution.
ADA Title III
The Americans with Disabilities Act, Title III. Prohibits discrimination by places of public accommodation, which courts have repeatedly held to include commercial websites of brick-and-mortar businesses. The Ninth Circuit's Robles v. Domino's Pizza ruling (2019; U.S. Supreme Court certiorari denied) is the controlling precedent. The Department of Justice's March 2022 guidance reaffirmed Title III's application to commercial websites. Federal courts cite WCAG 2.1 AA as the de facto compliance benchmark for digital accessibility under Title III.
AODA
Accessibility for Ontarians with Disabilities Act, 2005. Ontario provincial legislation that requires designated organizations to meet WCAG 2.0 Level AA on public-facing websites and intranets. Compliance reporting is mandatory under Ontario Regulation 191/11 (Integrated Accessibility Standards). Administrative monetary penalties for non-compliance reach $50,000 per day for an individual and $100,000 per day for a corporation, and accumulate while a violation goes unresolved.
WCAG 2.1 AA
Web Content Accessibility Guidelines 2.1, Level AA. The international accessibility standard maintained by the World Wide Web Consortium (W3C). AA is the conformance level most regulators reference. U.S. Department of Justice guidance under ADA Title III, AODA in Ontario, EN 301 549 in the European Union, and Accessible Canada Act regulations all use it.
Overlay widget
A JavaScript widget (AccessiBe, UserWay, EqualWeb, AudioEye, Recite Me, and similar) that overlays a settings panel on top of an existing website to expose limited accessibility controls. Overlays do not modify the underlying source code or repair WCAG violations at the DOM level. The WebAIM Overlay Fact Sheet documents the consensus position: overlays do not satisfy ADA, AODA, or WCAG. The Fervor Grade™ Framework measures the rendered DOM directly and ignores overlay presence.
axe-core
Open-source accessibility testing engine maintained by Deque Systems. Scans the rendered HTML/CSS/JS of a webpage and reports violations of WCAG 2.1 against the AA conformance level. Version 4.10.2 used here. Detects issues like missing alt-text on images, insufficient colour contrast, keyboard-trap navigation, missing form labels, broken landmark regions, and heading-order failures.
Largest Contentful Paint (LCP)
A Core Web Vital measuring how long it takes for the largest visible content element on the page (usually the hero image or hero headline) to fully render after a visitor lands. Google considers LCP good at or under 2.5 seconds, poor at or over 4 seconds.
Cumulative Layout Shift (CLS)
A Core Web Vital measuring how much visible page elements move or jump unexpectedly during the loading phase. High CLS causes accidental clicks (the user taps where a button used to be, and an ad or different button slides into that position at the last millisecond). Google considers CLS good at or under 0.10.
Total Blocking Time (TBT)
A Lighthouse metric capturing the cumulative time between First Contentful Paint and full interactivity during which the page is visibly rendered but cannot respond to user touch or click. High TBT typically indicates heavy JavaScript bundles or slow third-party scripts. Google considers TBT good at or under 200 milliseconds.
Call-to-action (CTA)
A visual element (button, link, or form) designed to prompt a user to take a specific conversion action. “Free quote / estimate” and “Phone in persistent header” are the highest-adoption CTAs in this trade. Generic “Contact us” phrasing is the lowest-converting common pattern in home services and the most common default fallback.
Trust stack
The set of credibility signals a contractor surfaces above the fold and within the first scroll: manufacturer certifications, license numbers, named-customer testimonials, before/after galleries, BBB and Google review aggregates, team photography, warranty and financing language. Top-quartile contractor brands surface 5 to 8 distinct trust signals before a visitor scrolls.
Form bloat
An intake form with more fields than the trade's conversion economics support, typically anything past five visible fields. Form-abandonment rates rise sharply past that threshold. The trade sample's worst examples push well past that threshold, often because a downstream CRM mapping was never refactored.
Persistent header
A site header pinned to the top of the viewport as the visitor scrolls. When a contractor's phone number lives inside the persistent header, voice-preferring visitors can call from any depth in the page. When the phone lives only at the very top, it disappears the moment a visitor scrolls past the hero.
Structured data (Schema.org)
A standardized JSON-LD markup format embedded in HTML that gives search engines explicit signals about a business's identity, services, ratings, and credentials. Properly typed HVACBusiness, LocalBusiness, or HomeAndConstructionBusiness markup feeds rich snippets, AI Overviews, and Google Business Profile enrichment.
Frequently asked questions about HVAC contractor websites
HVAC-specific answers grounded in the 104 sites Fervor Studio inspected in 2026. Every stat below traces back to a captured screenshot, an axe-core 4.10.2 evaluation, or a Google Lighthouse 13.3.0 measurement.
What is the average HVAC contractor website score?
Across the 104 HVAC contractor websites Fervor Studio inspected in 2026, the mean Fervor Score is 65.32 out of 100. Median is 65. Range runs from 31 to 90. Only 12 brands (about 12%) graded B or better. 63 brands (61%) graded D or F. HVAC sits in the same band as roofing on the overall composite, but the failure modes are different: HVAC sites tend to nail the phone-first basics and lose ground on speed and structured data instead.
Source: Fervor Studio, Contractor CRO Index 2026 (n=104 HVAC brands)
What are the best HVAC websites doing right?
The best HVAC websites in the 2026 trade sample combine four habits: a clickable phone number in the persistent header (74% of the trade has this, the highest-adoption HVAC signal we measured), online scheduling that actually books a slot (56.7%), Google reviews surfaced on the public page (76.9%), and at least one named maintenance plan or tune-up offer (67.3%). Brands that earned a Fervor Grade of B or higher hit three or four of those. Most of the trade hits one or two.
Source: Fervor Studio, Contractor CRO Index 2026 (n=104 HVAC brands)
How many HVAC contractor websites have a phone number in the header?
74% of HVAC contractor websites put a clickable phone number in the persistent header. That's 77 of 104 brands, the strongest-adoption conversion signal in the HVAC trade. Roughly a quarter of HVAC sites still make a homeowner hunt the footer on a phone. And HVAC is a phone-first trade. A homeowner whose furnace died at midnight isn't filling out a contact form, so HVAC lead generation lives or dies on whether the phone number is one tap away.
Source: Fervor Studio, Contractor CRO Index 2026 (n=104 HVAC brands)
What is the average mobile page load speed for HVAC websites?
On average, an HVAC homepage loads its biggest visible element in about 8.35s on a phone. That's the mean across the trade; the median is faster at 6.24s, because a handful of very slow sites drag the average up. Either way, Google's threshold for "good" is 2.5s; anything over 4s is officially "poor." So the average HVAC site sits deep in Google's poor band. Slow pages get dropped down the results page before the form even renders, per Google's page-experience guidance. Most of the speed deficit traces to oversized hero images and unscoped third-party scripts loaded in the head.
Source: Google Lighthouse 13.3.0 (mobile), Fervor Studio, Contractor CRO Index 2026 (n=104 HVAC brands)
How many HVAC websites have critical accessibility violations?
64.4% of HVAC contractor websites carry at least one critical WCAG 2.1 AA accessibility violation across the pages we captured. 98.1% carry a serious violation. We checked every page with axe-core 4.10.2 (the open-source accessibility checker the WCAG community trusts). That puts HVAC right alongside roofing on critical violations, and a touch better on the serious tier. But "alongside roofing" still means roughly six in ten brands ship a critical defect. Overlay widgets do not fix this. In Robles v. Domino's Pizza (9th Cir. 2019) the court held that the ADA applies to websites whose accessibility blocks a visitor from reaching the goods or services.
Source: axe-core 4.10.2 (WCAG 2.1 AA), Fervor Studio, Contractor CRO Index 2026 (n=104 HVAC brands)
What should an HVAC contractor website include?
Five conversion signals carry most of the score in the best HVAC website design we've seen across the trade sample. A clickable phone number in the persistent header (only 74% of HVAC brands have this). An inline form in the first visible chunk of the page (18.3% have it). A real online-scheduling tool, Calendly, Acuity, ServiceTitan, Housecall Pro, or a booking widget that returns a confirmed slot (56.7% of HVAC brands run one). A named maintenance-plan or tune-up offer the visitor can click into (67.3%). And visible trust signals: Google reviews surfaced on the page (76.9%), named license numbers (33.7%), and team or technician photography (72.1%).
Source: Fervor Studio, Contractor CRO Index 2026 (n=104 HVAC brands)
What schema markup do HVAC contractor websites use?
About 88.5% of HVAC contractor websites publish some JSON-LD structured data. That number is adoption, not richness. Most stop at Organization or LocalBusiness. Google's structured-data guidelines require every property listed under each rich-result type before a page is eligible to surface. Missing the nested Service, Review, AggregateRating, and FAQPage entities is the actual reason most HVAC sites do not earn star ratings in the SERP. SEO for HVAC companies is a structured-data game once you get past the basics.
Source: Fervor Studio, Contractor CRO Index 2026 (n=104 HVAC brands)
What conversion potential do HVAC websites have?
Five conversion signals were measured on every HVAC site. Phone in persistent header: 74%. Inline form on the hero: 18.3%. Chat widget with a vendor we could detect in the page code: 27.9% (the conversion-infrastructure table on this page counts any chat presence, including manual embeds, at a slightly broader 31.7%). Online scheduling tool: 56.7%. Text-message contact channel: 23.1%. HVAC scores better on the phone-first basics than most trades, but the chat and text channels are still niche. A homeowner who prefers text-first contact lands on the wrong website three out of four times in the trade sample.
Source: Fervor Studio, Contractor CRO Index 2026 (n=104 HVAC brands)
How many HVAC websites surface Google reviews?
76.9% of HVAC contractor websites surface their Google reviews somewhere a buyer can see them. A brand qualifies if their site links to their Google Business Profile, runs a review widget (NiceJob, BirdEye, Podium), publishes a structured review block, or just writes "4.9 stars on Google" in the page copy. So roughly a quarter of HVAC brands run their entire site without showing the social proof a homeowner is hunting for in the first ten seconds.
Source: Fervor Studio, Contractor CRO Index 2026 (n=104 HVAC brands)
How many HVAC websites mention air conditioning, furnaces, and heat pumps?
84.6% of HVAC contractor websites mention air conditioning as a service. 69.2% mention furnace work. 63.5% mention heat pumps. 67.3% mention indoor air quality. These are coverage-map numbers, not specialization. An HVAC brand that lists heat pumps among ten services counts the same as a heat-pump specialist. The labels on this page won't tell you who's a real specialist. The click into each site will.
Source: Fervor Studio, Contractor CRO Index 2026 (n=104 HVAC brands)
How is Fervor Studio measuring HVAC contractor websites?
Same process on every brand. We capture screenshots at desktop and mobile width across every page our crawler can reach. We read the underlying page (forms, structured markup, phone and email links, manufacturer badges, review widgets, chat widgets). We run axe-core 4.10.2 against WCAG 2.1 AA. And we measure Core Web Vitals with Google Lighthouse 13.3.0. That's about 150 individual measurements per page. The Fervor Grade Framework then scores what we captured. 104 HVAC brands in the 2026 trade sample. Four of those brands were re-captured with only their homepage DOM surviving, so their structured-data, phone, and form counts rest on a single page. That is a conservative floor that understates rather than inflates their totals.
Source: Fervor Studio, Contractor CRO Index 2026 (n=104 HVAC brands)


Want to know how good your HVAC website is?
Every Site Inspection runs the same framework and evidence captures as the 104 HVAC brands on this page. Start with a free Site Inspection, or compare side-by-side with the roofing, remodeling, or cross-trade reports.
Social platform & review presence
Live, clickable links on the page. Not text mentions of a platform name, not a hashtag. So when a platform's share reads 78% below, that means 78% of the sites we could read carry a working link to it in their navigation or footer. It does not mean their Facebook page gets updated, or that anyone follows them, or that they've posted this quarter. A live link is the floor. What gets done with the channel is a separate question.