Remodeling Website Design: 146 Sites, and Nearly Half Lose Leads
Across 146 remodeling sites, the quality gap is the widest of any trade and nearly half lose the leads they paid for. See the remodeling website design fix.

Here's the number that stops you cold. When Fervor checked 146 remodeling contractor websites this spring, the gap between the worst and the best was the widest of any trade we've measured. The worst sites were barely usable, no clear way to call, nothing that loads on a phone. The best loaded fast and put the work and the phone number front and centre. So when you think about your own remodeling website design, understand the field you're standing in. It's not a tight pack where everyone's roughly even. It's a long, brutal tail, and somebody's sitting at the very bottom of it.
And here's the part that should bother you more. Not one of the 146 nailed every fundamental. Not one. The best site got close, fast load, clear calls to action, real trust signals, the work up front, so the ceiling is reachable. Somebody nearly touched it. But not one remodeler in 146 actually got all the way there. The room at the top is empty.
So this isn't a story about a hard trade or impossible standards. The gap is design and execution, plain as that. Let's walk through what the spread actually says, where most remodeling sites leak, and what it costs you to sit in the middle of a pack this wide.
What the widest quality spread in the trade actually means
Let me give you the full picture, because a range alone is easy to shrug off. The State of Remodeling report ran 146 contractor sites through the same six-category framework every trade gets scored against. The spread came back wider than roofing, wider than HVAC, wider than anything else we've looked at.
- The gap from the worst site to the best was the widest of any trade Fervor checked.
- Not one site nailed every fundamental. Even the best still missed something.
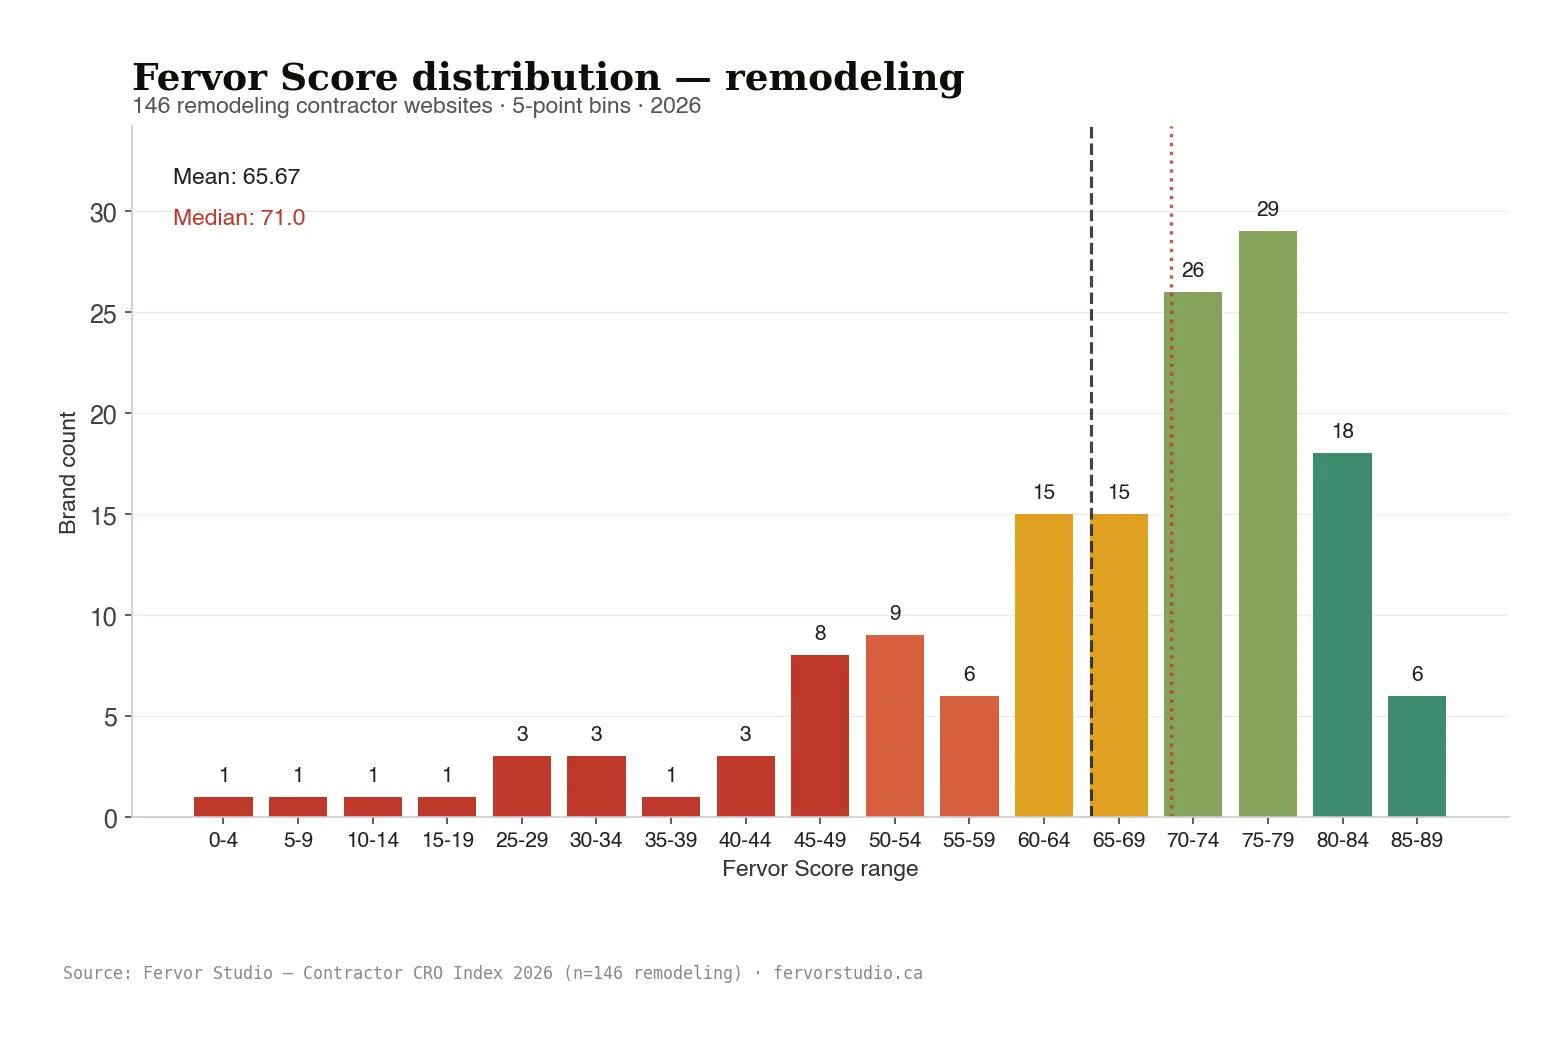
- The average site scored 65.67 out of 100, below the line where a site reliably turns visitors into calls.
- The median was 71, and the standard deviation was 16.68.
So read that standard deviation again. A 16.68 spread is enormous. It means remodeling sites aren't clustered around some shared average. They're scattered across the whole board, from genuinely good to genuinely broken, with no center of gravity holding them together. Your competitor down the road might be running a fast, polished site while the one across town runs a broken one. Same trade, same homeowners, wildly different sites.
So the widest gap isn't a quirk of the data. It's the headline. In most trades you can assume your competition is roughly where you are. Not here.
The empty room at the top of the market
This is the stat I keep coming back to. Of 146 remodeling sites, not one nailed every fundamental. The best got close, fast, clear, trustworthy, the work up front, but it still left a few points on the table. Close. Not there.
Why does that matter to you? Because it means the top of your market is wide open. In a trade where the leader still leaves points on the table, you don't need a perfect site to win. You need a good one. The bar to become the best remodeling website in your area is lower than it'd be in a trade where three competitors already run flawless sites and you're playing catch-up.
That near-miss also proves the ceiling is real. Somebody got within striking distance of a flawless site using the same homeowners, the same project types, the same review platforms you have access to. Nothing about remodeling stops a site from doing the fundamentals well. The trade isn't the problem. So if your site's leaking leads, the gap between you and the top isn't some mystery. It's a list of specific, fixable things the best site got right and you didn't.
The bottom drops to barely usable, and that's the real warning
Now the other end. One site scored a 3 out of 100. Three.
I want you to sit with that for a second, because it's not a typo and it's not an outlier nobody else is near. A 3 means a homeowner lands on that page and finds almost nothing they can use. No clear way to call, no portfolio that loads, no reason to trust the company, nothing that works on a phone. That's a remodeling business actively repelling the leads it paid to attract.
And the long tail below the median is crowded. Nearly half the trade, 45.9%, or 67 of 146 sites, failed at least one fundamental test outright. So this isn't a handful of stragglers dragging down an otherwise healthy field. It's almost half the trade failing the basics a homeowner notices in seconds. If your remodeler web design has been coasting on word-of-mouth and a site you haven't touched in four years, the odds you're in that bottom half are uncomfortably high.
Here's the loss-framing version. Every week that site sits broken, you're paying for it. In homeowners who clicked, saw nothing worth their $55,000 kitchen project, and bounced to the next result. They don't tell you they left. They just leave.
Why remodeling sites land all over the board
So what's actually creating a gap this wide? A few things specific to how remodelers build and neglect their sites.
First, remodeling is a portfolio trade and most sites treat it like an afterthought. The work is visual. Before-and-after transformations are the entire pitch. Yet the data shows a before/after gallery on just 44.5% of sites. Fewer than half. So more than half of remodelers are asking a homeowner to imagine a $75,000 kitchen transformation with no visual proof it's been done before. That's a layup most of the trade is missing.
Second, third-party proof is thin. Houzz presence showed up on only 39.3% of sites. For a trade where homeowners spend roughly nine to ten months just planning a project, the platforms that host reviews, photos, and design ideas aren't optional. They're where the buyer lives during the longest phase of the decision. Six in ten remodeling sites aren't even pointing to that proof.
The portfolio gap, in plain math
Run the numbers on the gallery alone. Say you close one in five of the homeowners who seriously engage with your site, and your average project runs $55,000. If a missing before/after gallery costs you even one engaged lead a month, one homeowner who couldn't picture the work and went elsewhere, that's one project a year you didn't book. Call it $55,000. From a gallery you already have the photos for, sitting in a folder on your phone.
That's the kind of gap that separates a top site from a middling one. Not budget. Not talent. Execution on the obvious stuff.
What the best remodeling websites do that the rest don't
But look at the top of the spread and a pattern shows up. The remodeling website examples scoring in the 80s aren't doing anything exotic. They're doing the fundamentals, completely, where the bottom of the trade does them halfway or not at all.
And they lead with the work. Before-and-after galleries on the homepage, not buried three clicks deep. They make the next step obvious, whether that's a call, a consult, or an estimate request, visible without scrolling. They carry the trust signals a six-figure project demands: reviews, project counts, the Houzz and Google proof a planning homeowner spends months reading.
And they work on a phone, because that's where the homeowner is when they're lying in bed at 11pm doom-scrolling kitchen ideas. The best remodeling websites don't win on flash. They win because every basic conversion job is actually done.
It's a checklist, not a rebuild
Here's the encouraging part. The best site didn't require a custom platform or a five-figure agency retainer. It required the fundamentals executed all the way through. So the path from a middling site to the top of your market isn't a teardown. It's closing the specific gaps the leaders already closed.
That's also why the spread is so wide. The sharpest sites and the broken ones often had the same budget. One crew finished the job. The other shipped a template and walked away.
Where remodeling website design and lead capture overlap
One more angle, because it reframes the whole thing. The same gaps that drag down a site's score also leak leads directly. They're the same problem wearing two labels.
A missing before/after gallery doesn't just cost you a category point. It costs you the homeowner who needed to see the transformation before trusting you with their house. A buried phone number doesn't just ding your conversion score. It sends a ready-to-call lead to the competitor whose number was right there. Thin trust signals don't just lower a number on a report. They lose you the buyer who spent nine months researching and picked the company that showed its work.
So a strong remodeling website design isn't a vanity exercise or a design-award chase. It's the difference between a homeowner who books you and one who books the site that did the fundamentals. The score and the revenue move together, because they're measuring the same thing from two directions.
That's the whole reason the framework scores what it scores. Every category maps to a real moment where a homeowner decides whether to call you or close the tab: first impression, trust, lead capture, mobile, content, the visual proof. Fix the markup and the gallery and the trust signals, and you're not chasing a number. You're plugging the exact leaks that are sending your projects across town.
How to find out where your remodeling site actually stands
You can't fix a gap you can't see, and a remodeling site is the hardest thing to judge from the inside. You built it, you know where everything is, so it always "looks fine" to you. The homeowner doesn't have your map. They have a phone, a furrowed brow, and four other tabs open.
So stop guessing. Pull up your site on your phone, not your laptop, and try to do what a homeowner does. Find the gallery. Find the phone number without scrolling twice. Find one reason to trust you with a $55,000 project in the first ten seconds. If any of those takes effort, that's a point you're leaving on the table, and in a trade this wide, points are projects.
The State of Remodeling report measured all of it across 146 sites so you'd have a real benchmark instead of a hunch. Now you know the spread. You know the ceiling's empty and the floor drops to barely usable. The only question left is which end of that spread you're on, and that one, you can actually change.
Frequently asked questions
What is the average remodeling website score?
Across 146 remodeling contractor websites, the State of Remodeling report found an average score of 65.67 out of 100, below the line where a site reliably converts. The median was 71. But the average hides the real story: with a standard deviation of 16.68, remodeling sites are scattered from barely usable to genuinely sharp rather than clustered near that average. The widest spread of any trade Fervor checked.
Why does no remodeling website nail every fundamental?
Of the 146 sites checked, none nailed every fundamental. The best site got close but still left a few points on the table. It's not because remodeling is impossible to do well online. It's because no contractor executed all the basics completely. The ceiling is reachable, but the room at the top of the market is currently empty, which makes it easier to claim.
What makes the best remodeling websites convert?
The remodeling website examples scoring in the 80s do the basics completely: before-and-after galleries up front, an obvious next step, real trust signals, and a site that works on a phone. The data shows a before/after gallery on only 44.5% of sites and Houzz presence on just 39.3%. So simply doing the visual-proof fundamentals already puts you ahead of more than half the trade.
How wide is the quality gap in remodeling website design?
Wider than any trade Fervor has checked. The gap runs from barely usable to genuinely sharp, with a standard deviation of 16.68. That means your competitors aren't clustered near a shared average. One might run a fast, polished site while another runs a broken one, in the same market. The gap is execution, not the trade itself.
How do I know where my remodeling site ranks?
Pull it up on your phone and try to do what a homeowner does: find the gallery, find the phone number, find a reason to trust you in ten seconds. If any of that takes effort, those are points you're leaving on the table. A free Site Inspection scores your site against the same six categories the 146-site report used, and returns the exact list of what's costing you projects.
Methodology
Where these numbers come from
Every figure in this post traces to the State of Remodeling report, part of the Contractor CRO Index. Fervor scored 146 remodeling contractor websites against six conversion categories in the Fervor Grade Framework, using axe-core for accessibility and Lighthouse for performance across every captured page. The score range (3 to 86), mean (65.67), median (71), and standard deviation (16.68) are sample-level aggregates. Every site in the sample is named and publicly graded inside the Contractor CRO Index — this report is the aggregate layer on top of those public teardowns.
See where your remodeling site actually stands
You've seen the spread. The worst remodeling sites are barely usable, the best put the work and the phone number front and centre, and nearly half failed at least one fundamental a homeowner notices in seconds. So the real question is which end you're on. The State of Remodeling report, part of the Contractor CRO Index, shows exactly how the trade scores across six conversion categories. And if you want your own remodeling website design built to land at the top of that range instead of the bottom, Booked by Design closes the specific gaps the leaders already closed.
Get Booked by Design →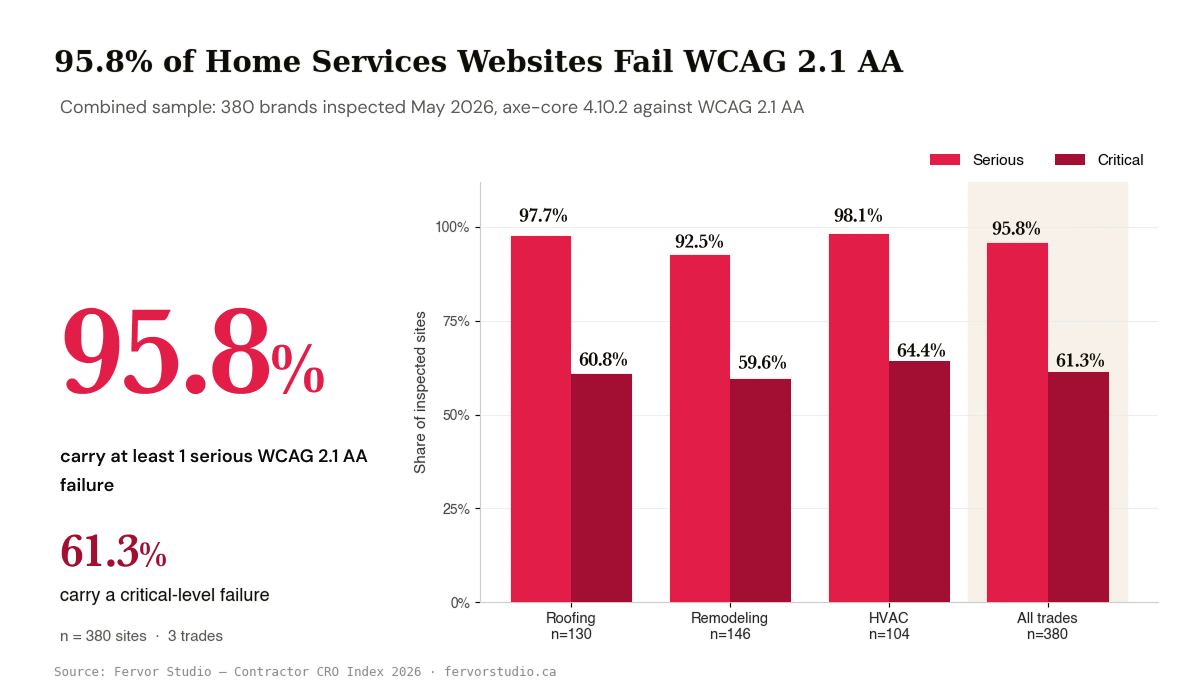 Jun 17, 2026
 Accessibility
95.8% of Home Services Websites Fail the Standard Behind ADA Lawsuits
An independent study of 380 home services websites found 95.8% carry serious WCAG 2.1 AA failures and 61.3% carry critical ones. Accessibility was the study's weakest category.
Read Article Jun 2, 2026
 CRO
HVAC Website Conversion: Where 26% of Sites Lose the Call
74% of HVAC sites nail the phone-in-header, but most leave online scheduling, SMS, and a hero lead form on the table. That gap is where the calls leak out.
Read Article Jun 2, 2026
 CRO
HVAC Maintenance Plan Website: The Upsell 2 in 3 Surface
Two in three HVAC sites surface the maintenance-plan upsell, and a third bury it. Here is what a strong maintenance-plan page does, plus the recurring revenue the rest leave uncaptured.
Read Article